- Collection:
- Georgia Government Publications
- Serial:
- Broiler hatchery news release / United States Department of Agriculture National Agricultural Statistics Service.
- Title:
- Southern region broiler hatchery news release [Jan. 11, 2017]
- Creator:
- Georgia. Agricultural Statistics Service
- Contributor to Resource:
- Georgia. Agricultural Statistics Service
- Publisher:
- Athens, GA : Georgia. Agricultural Statistics Service
- Date of Original:
- 2017-01-11
- Subject:
- Georgia
- Location:
- United States, Georgia, 32.75042, -83.50018
- Medium:
- publications (documents)
- Type:
- Text
- Format:
- application/pdf
- Description:
- Began with: August 28, 2013.
Effective March 12, 2014, name of issuing body appears as Southern Regional Field Office.
August 28, 2013; title from caption (Georgia Government Publications database, viewed January 19, 2018).
January 17, 2018 (received via e-mail on January 18, 2018 from Georgia Department of Agriculture); (Georgia Government Publications database, viewed November 22, 2017). - External Identifiers:
- Call Number GA A400.C7 P1 H2 2017/1-11
- Metadata URL:
- https://dlg.galileo.usg.edu/id:dlg_ggpd_i-ga-ba400-pc7-bp1-bh2-b2017-s1-h11-belec-p-btext
- Digital Object URL:
- https://dlg.galileo.usg.edu/do:dlg_ggpd_i-ga-ba400-pc7-bp1-bh2-b2017-s1-h11-belec-p-btext
- Language:
- eng
- Holding Institution:
- University of Georgia. Map and Government Information Library
- Rights:
-

United States Department of Agriculture National Agricultural Statistics Service
Southern Region News Release Broiler Hatchery
Cooperating with the Alabama Department of Agriculture and Industries, Florida Department of Agriculture and Consumer Services, Georgia Department of Agriculture, and South Carolina Department of Agriculture
Southern Regional Field Office 355 East Hancock Avenue, Suite 100 Athens, GA 30601 (706) 546-2236 www.nass.usda.gov
January 11, 2017
Media Contact: Jim Ewing
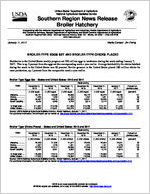
BROILER-TYPE EGGS SET AND BROILER-TYPE CHICKS PLACED
Hatcheries in the United States weekly program set 220 million eggs in incubators during the week ending January 7, 2017. This is up 2 percent from the eggs set the corresponding week a year earlier. Average hatchability for chicks hatched during the week in the United States was 83 percent. Broiler growers in the United States placed 180 million chicks for meat production, up 1 percent from the comparable week a year earlier.
Broiler-Type Eggs Set States and United States: 2016 and 2017
State
December 3, 2016
December 10, 2016
December 17, 2016
Week ending
December 24, 2016
(1,000 eggs)
(1,000 eggs)
(1,000 eggs)
(1,000 eggs)
Alabama ............. Florida ................ Georgia .............. South Carolina....
29,741 1,220
34,467 5,540
30,008 1,224
34,015 5,455
29,855 1,193
34,335 5,754
29,772 1,207
34,521 5,514
December 31, 2016
(1,000 eggs)
30,274 1,021
34,245 5,712
January 7, 2017
(1,000 eggs)
29,790 1,175
34,007 5,681
Percent of previous year
(percent)
101 96
100 99
19 State total ......
211,087
210,756
211,655
210,789
212,137
211,350
102
United States ......
219,852
219,541
220,479
219,452
220,789
219,876
102
Source: USDA National Agricultural Statistics Service, Broiler Hatchery, January 11, 2017. For additional information, the full report can be viewed at http://usda.mannlib.cornell.edu/MannUsda/viewDocumentInfo.do?documentID=1010
Broiler-Type Chicks Placed States and United States: 2016 and 2017
State
December 3, 2016
December 10, 2016
December 17, 2016
Week ending
December 24, 2016
(1,000 chicks) (1,000 chicks) (1,000 chicks) (1,000 chicks)
Alabama ............. Florida ................ Georgia .............. South Carolina....
22,408 1,307
27,223 5,562
21,840 1,278
27,317 5,421
21,677 1,331
28,869 3,992
22,403 1,341
27,446 4,500
December 31, 2016
(1,000 chicks)
22,804 1,161
26,447 4,773
January 7, 2017
(1,000 chicks)
22,331 1,376
27,627 4,613
Percent of previous year
(percent)
99 104 105
80
19 State total ......
170,588
172,410
172,372
172,386
172,095
172,521
101
United States ......
177,530
179,346
179,392
179,306
179,290
179,648
101
Source: USDA National Agricultural Statistics Service, Broiler Hatchery, January 11, 2017. For additional information, the full report can be viewed at http://usda.mannlib.cornell.edu/MannUsda/viewDocumentInfo.do?documentID=1010
USDA is an equal opportunity provider and employer. All NASS reports are available, at no cost, on the NASS website: http://www.nass.usda.gov
Broiler-Type Eggs Set 19 Selected States and United States: 2016 and 2017
State
December 3, 2016
December 10, 2016
Week ending
December 17, December 24,
2016
2016
(1,000 eggs)
(1,000 eggs)
(1,000 eggs)
(1,000 eggs)
Alabama ............................................ Arkansas ............................................ Delaware ............................................ Florida ............................................... Georgia .............................................. Kentucky ............................................. Louisiana ............................................ Maryland ............................................. Mississippi .......................................... Missouri ..............................................
29,741 22,611
5,052 1,220 34,467 7,689 3,833 8,065 17,373 8,171
30,008 22,637
5,101 1,224 34,015 7,671 3,833 8,086 17,571 8,167
29,855 22,760
5,054 1,193 34,335 7,396 3,833 8,140 17,586 8,157
29,772 22,314
4,926 1,207 34,521 7,448 3,848 8,138 17,525 8,169
December 31, 2016
(1,000 eggs)
30,274 22,734
5,003 1,021 34,245 7,167 3,788 8,126 17,788 7,960
North Carolina .................................... Oklahoma ........................................... Pennsylvania ...................................... South Carolina .................................. Texas ................................................. Virginia ............................................... California, Tennessee,
and West Virginia ..............................
20,727 7,404 4,933 5,540
15,803 6,474
11,984
20,782 7,482 4,571 5,455
15,946 6,504
11,703
20,772 7,619 4,704 5,754
15,944 6,498
12,055
20,849 7,435 4,791 5,514
15,806 6,505
12,021
21,327 7,831 4,819 5,712
15,799 6,387
12,156
19 State total ...................................... Percent of previous year .....................
211,087 104
210,756 102
211,655 101
210,789 102
212,137 103
Other States .......................................
8,765
8,785
8,824
8,663
8,652
United States ...................................... Percent of previous year .....................
219,852 105
219,541 102
220,479 102
219,452 102
220,789 104
January 7, 2017
(1,000 eggs)
29,790 22,413
5,090 1,175 34,007 7,245 3,348 8,125 17,495 8,101
21,462 7,815 4,704 5,681
16,030 6,513
12,356
211,350 102
8,526
219,876 102
Broiler-Type Chicks Placed 19 Selected States and United States: 2016 and 2017
State
December 3, 2016
December 10, 2016
Week ending
December 17, December 24,
2016
2016
(1,000 chicks) (1,000 chicks) (1,000 chicks) (1,000 chicks)
Alabama ............................................ Arkansas ............................................ Delaware ............................................ Florida ............................................... Georgia .............................................. Kentucky ............................................. Louisiana ............................................ Maryland ............................................. Mississippi .......................................... Missouri ..............................................
22,408 20,240
5,278 1,307 27,223 5,654 2,994 6,324 14,079 5,904
21,840 20,824
5,345 1,278 27,317 6,211 3,041 6,285 14,778 6,600
21,677 21,875
5,488 1,331 28,869 6,288 3,191 5,794 14,582 6,039
22,403 20,939
4,709 1,341 27,446 6,347 3,262 7,494 14,565 5,942
December 31, 2016
(1,000 chicks)
22,804 21,701
4,989 1,161 26,447 5,955 3,290 7,425 14,668 5,793
January 7, 2017
(1,000 chicks)
22,331 20,999
5,859 1,376 27,627 5,688 3,262 5,839 14,756 5,915
North Carolina .................................... Oklahoma ........................................... Pennsylvania ...................................... South Carolina .................................. Texas ................................................. Virginia ............................................... California, Tennessee,
and West Virginia ..............................
16,232 4,906 3,813 5,562
12,976 5,301
10,387
16,348 3,963 3,509 5,421
13,053 5,855
10,742
16,045 3,851 3,740 3,992
13,111 6,322
10,177
16,175 4,647 3,783 4,500
12,927 5,013
10,893
16,602 4,092 3,641 4,773
13,015 4,608
11,131
16,701 4,618 3,669 4,613
13,206 5,649
10,413
19 State total ...................................... Percent of previous year .....................
170,588 100
172,410 101
172,372 101
172,386 104
172,095 101
172,521 101
Other States .......................................
6,942
6,936
7,020
6,920
7,195
7,127
United States ...................................... Percent of previous year .....................
177,530 101
179,346 101
179,392 101
179,306 104
179,290 102
179,648 101
Source: USDA National Agricultural Statistics Service, Broiler Hatchery, January 11, 2017. For additional information, the full report can be viewed at http://usda.mannlib.cornell.edu/MannUsda/viewDocumentInfo.do?documentID=1010
USDA is an equal opportunity provider and employer. All NASS reports are available, at no cost, on the NASS website: http://www.nass.usda.gov