- Collection:
- Georgia Government Publications
- Serial:
- Broiler hatchery news release / United States Department of Agriculture National Agricultural Statistics Service.
- Title:
- Southern region broiler hatchery news release [Aug. 3, 2016]
- Creator:
- Georgia. Agricultural Statistics Service
- Contributor to Resource:
- Georgia. Agricultural Statistics Service
- Publisher:
- Athens, GA : Georgia. Agricultural Statistics Service
- Date of Original:
- 2016-08-03
- Subject:
- Georgia
- Location:
- United States, Georgia, 32.75042, -83.50018
- Medium:
- publications (documents)
- Type:
- Text
- Format:
- application/pdf
- Description:
- Began with: August 28, 2013.
Effective March 12, 2014, name of issuing body appears as Southern Regional Field Office.
August 28, 2013; title from caption (Georgia Government Publications database, viewed January 19, 2018).
January 17, 2018 (received via e-mail on January 18, 2018 from Georgia Department of Agriculture); (Georgia Government Publications database, viewed November 22, 2017). - External Identifiers:
- Call Number GA A400.C7 P1 H2 2016/8-3
- Metadata URL:
- https://dlg.galileo.usg.edu/id:dlg_ggpd_i-ga-ba400-pc7-bp1-bh2-b2016-s8-h3-belec-p-btext
- Digital Object URL:
- https://dlg.galileo.usg.edu/do:dlg_ggpd_i-ga-ba400-pc7-bp1-bh2-b2016-s8-h3-belec-p-btext
- Language:
- eng
- Holding Institution:
- University of Georgia. Map and Government Information Library
- Rights:
-

United States Department of Agriculture National Agricultural Statistics Service
Southern Region News Release Broiler Hatchery
Cooperating with the Alabama Department of Agriculture and Industries, Florida Department of Agriculture and Consumer Services, Georgia Department of Agriculture, and South Carolina Department of Agriculture
Southern Regional Field Office 355 East Hancock Avenue, Suite 100 Athens, GA 30601 (706) 546-2236 www.nass.usda.gov
August 3, 2016
Media Contact: Jim Ewing
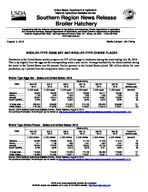
BROILER-TYPE EGGS SET AND BROILER-TYPE CHICKS PLACED
Hatcheries in the United States weekly program set 215 million eggs in incubators during the week ending July 30, 2016. This is up slightly from the eggs set the corresponding week a year earlier. Average hatchability for chicks hatched during the week in the United States was 84 percent. Broiler growers in the United States placed 180 million chicks for meat production, up 1 percent from the comparable week a year earlier.
Broiler-Type Eggs Set States and United States: 2016
State
Alabama ............. Florida ................ Georgia .............. South Carolina....
June 25, 2016
(1,000 eggs)
28,993 1,145
35,097 6,428
July 2, 2016
(1,000 eggs)
29,226 1,224
34,314 5,601
July 9, 2016
(1,000 eggs)
28,770 1,224
34,620 5,533
Week ending
July 16, 2016
(1,000 eggs)
28,865 1,225
34,762 5,233
July 23, 2016
(1,000 eggs)
28,717 1,225
34,897 5,616
July 30, 2016
(1,000 eggs)
29,096 1,225
33,882 5,288
Percent of previous year
(percent)
100 100 100
98
19 State total ......
209,504
206,692
210,303
210,105
209,025
206,686
101
United States ......
218,166
215,255
218,573
218,357
216,819
215,201
100
Source: USDA National Agricultural Statistics Service, Broiler Hatchery, August 3, 2016. For additional information, the full report can be viewed at http://usda.mannlib.cornell.edu/MannUsda/viewDocumentInfo.do?documentID=1010
Broiler-Type Chicks Placed States and United States: 2016
State
June 25, 2016
July 2, 2016
July 9, 2016
Week ending
July 16, 2016
(1,000 chicks) (1,000 chicks) (1,000 chicks) (1,000 chicks)
Alabama ............. Florida ................ Georgia .............. South Carolina....
20,982 1,211
28,054 5,765
22,068 1,198
27,923 5,848
20,961 1,489
28,088 5,616
21,184 1,341
28,953 5,876
July 23, 2016
(1,000 chicks)
21,576 1,602
28,106 4,731
July 30, 2016
(1,000 chicks)
21,516 1,241
27,833 4,854
Percent of previous year
(percent)
97 108 103
96
19 State total ......
172,963
174,543
172,026
172,186
169,459
172,868
101
United States ......
179,982
181,093
178,871
179,051
176,351
179,732
101
Source: USDA National Agricultural Statistics Service, Broiler Hatchery, August 3, 2016. For additional information, the full report can be viewed at http://usda.mannlib.cornell.edu/MannUsda/viewDocumentInfo.do?documentID=1010
USDA is an equal opportunity provider and employer. All NASS reports are available, at no cost, on the NASS website: http://www.nass.usda.gov
Broiler-Type Eggs Set 19 Selected States and United States: 2016
State
June 25, 2016
July 2, 2016
Week ending
July 9, 2016
July 16, 2016
(1,000 eggs)
(1,000 eggs)
(1,000 eggs)
(1,000 eggs)
Alabama ............................................ Arkansas ............................................ Delaware ............................................ Florida ............................................... Georgia .............................................. Kentucky ............................................. Louisiana ............................................ Maryland ............................................. Mississippi .......................................... Missouri ..............................................
28,993 21,553
5,080 1,145 35,097 7,682 3,591 8,081 17,993 7,841
29,226 21,593
4,942 1,224 34,314 7,128 3,500 7,974 18,288 7,466
28,770 22,699
4,578 1,224 34,620 7,799 3,530 7,950 18,439 7,676
28,865 22,738
4,947 1,225 34,762 7,887 3,530 7,816 18,333 7,737
North Carolina .................................... Oklahoma ........................................... Pennsylvania ...................................... South Carolina .................................. Texas ................................................. Virginia ............................................... California, Tennessee,
and West Virginia ..............................
20,614 7,025 4,564 6,428
15,734 6,529
11,554
19,641 7,338 4,495 5,601
15,300 6,597
12,065
20,842 7,385 4,443 5,533
15,676 6,602
12,537
20,850 7,203 4,693 5,233
15,627 6,510
12,149
19 State total ...................................... Percent of previous year .....................
209,504 100
206,692 100
210,303 101
210,105 101
Other States .......................................
8,662
8,563
8,270
8,252
United States ...................................... Percent of previous year .....................
218,166 100
215,255 100
218,573 101
218,357 101
July 23, 2016
(1,000 eggs)
28,717 22,421
4,950 1,225 34,897 7,993 3,530 7,861 17,487 7,878
20,871 7,100 4,701 5,616
15,237 6,519
12,022
209,025 100
7,794
216,819 100
July 30, 2016
(1,000 eggs)
29,096 22,051
4,900 1,225 33,882 7,400 3,440 7,723 17,292 7,993
20,874 7,360 4,579 5,288
15,243 6,500
11,840
206,686 100
8,515
215,201 100
Broiler-Type Chicks Placed 19 Selected States and United States: 2016
State
June 25, 2016
July 2, 2016
Week ending
July 9, 2016
July 16, 2016
(1,000 chicks) (1,000 chicks) (1,000 chicks) (1,000 chicks)
Alabama ............................................ Arkansas ............................................ Delaware ............................................ Florida ............................................... Georgia .............................................. Kentucky ............................................. Louisiana ............................................ Maryland ............................................. Mississippi .......................................... Missouri ..............................................
20,982 20,911
4,817 1,211 28,054 6,265 3,252 6,693 15,126 5,820
22,068 20,623
4,126 1,198 27,923 6,653 3,239 7,720 15,031 6,038
20,961 21,024
5,401 1,489 28,088 6,263 3,114 6,140 14,732 5,997
21,184 19,985
5,401 1,341 28,953 6,820 3,204 6,197 15,071 5,703
July 23, 2016
(1,000 chicks)
21,576 21,134
5,319 1,602 28,106 5,808 3,113 5,633 14,892 4,973
July 30, 2016
(1,000 chicks)
21,516 20,763
4,928 1,241 27,833 6,219 3,134 5,742 15,055 6,007
North Carolina .................................... Oklahoma ........................................... Pennsylvania ...................................... South Carolina .................................. Texas ................................................. Virginia ............................................... California, Tennessee,
and West Virginia ..............................
16,666 4,097 3,595 5,765
12,978 5,724
11,007
16,426 4,900 3,630 5,848
13,152 5,369
10,599
16,284 3,822 3,601 5,616
12,401 5,693
11,400
16,424 4,679 3,429 5,876
12,936 5,200
9,783
16,018 3,969 3,245 4,731
12,983 5,916
10,441
17,317 4,601 3,177 4,854
13,297 5,998
11,186
19 State total ...................................... Percent of previous year .....................
172,963 99
174,543 101
172,026 100
172,186 100
169,459 99
172,868 101
Other States .......................................
7,019
6,550
6,845
6,865
6,892
6,864
United States ...................................... Percent of previous year .....................
179,982 99
181,093 101
178,871 100
179,051 100
176,351 100
179,732 101
Source: USDA National Agricultural Statistics Service, Broiler Hatchery, August 3, 2016. For additional information, the full report can be viewed at http://usda.mannlib.cornell.edu/MannUsda/viewDocumentInfo.do?documentID=1010
USDA is an equal opportunity provider and employer. All NASS reports are available, at no cost, on the NASS website: http://www.nass.usda.gov