- Collection:
- Georgia Government Publications
- Serial:
- Broiler hatchery news release / United States Department of Agriculture National Agricultural Statistics Service.
- Title:
- Southern region broiler hatchery news release [May 25, 2016]
- Creator:
- Georgia. Agricultural Statistics Service
- Contributor to Resource:
- Georgia. Agricultural Statistics Service
- Publisher:
- Athens, GA : Georgia. Agricultural Statistics Service
- Date of Original:
- 2016-05-25
- Subject:
- Georgia
- Location:
- United States, Georgia, 32.75042, -83.50018
- Medium:
- publications (documents)
- Type:
- Text
- Format:
- application/pdf
- Description:
- Began with: August 28, 2013.
Effective March 12, 2014, name of issuing body appears as Southern Regional Field Office.
August 28, 2013; title from caption (Georgia Government Publications database, viewed January 19, 2018).
January 17, 2018 (received via e-mail on January 18, 2018 from Georgia Department of Agriculture); (Georgia Government Publications database, viewed November 22, 2017). - External Identifiers:
- Call Number GA A400.C7 P1 H2 2016/5-25
- Metadata URL:
- https://dlg.galileo.usg.edu/id:dlg_ggpd_i-ga-ba400-pc7-bp1-bh2-b2016-s5-h25-belec-p-btext
- Digital Object URL:
- https://dlg.galileo.usg.edu/do:dlg_ggpd_i-ga-ba400-pc7-bp1-bh2-b2016-s5-h25-belec-p-btext
- Language:
- eng
- Holding Institution:
- University of Georgia. Map and Government Information Library
- Rights:
-

United States Department of Agriculture National Agricultural Statistics Service
Southern Region News Release Broiler Hatchery
Cooperating with the Alabama Department of Agriculture and Industries, Florida Department of Agriculture and Consumer Services, Georgia Department of Agriculture, and South Carolina Department of Agriculture
Southern Regional Field Office 355 East Hancock Avenue, Suite 100 Athens, GA 30601 (706) 546-2236 www.nass.usda.gov
May 25, 2016
Media Contact: Jim Ewing
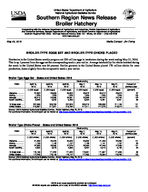
BROILER-TYPE EGGS SET AND BROILER-TYPE CHICKS PLACED
Hatcheries in the United States weekly program set 220 million eggs in incubators during the week ending May 21, 2016. This is up 1 percent from the eggs set the corresponding week a year earlier. Average hatchability for chicks hatched during the week in the United States was 84 percent. Broiler growers in the United States placed 179 million chicks for meat production, down slightly from the comparable week a year earlier.
Broiler-Type Eggs Set States and United States: 2016
State
Alabama ............. Florida ................ Georgia .............. South Carolina....
April 16, 2016
(1,000 eggs)
27,892 1,225
35,213 5,529
April 23, 2016
(1,000 eggs)
28,655 1,225
34,589 5,333
April 30, 2016
(1,000 eggs)
28,833 1,225
34,061 5,450
Week ending
May 7, 2016
(1,000 eggs)
28,972 1,225
33,888 5,554
May 14, 2016
(1,000 eggs)
28,312 1,225
34,472 5,481
May 21, 2016
(1,000 eggs)
28,674 1,225
34,740 5,491
Percent of previous year
(percent)
97 100 102
96
19 State total ......
207,568
208,763
207,924
209,219
208,588
211,155
101
United States ......
215,867
217,521
216,762
217,411
217,078
219,812
101
Source: USDA National Agricultural Statistics Service, Broiler Hatchery, May 25, 2016. For additional information, the full report can be viewed at http://usda.mannlib.cornell.edu/MannUsda/viewDocumentInfo.do?documentID=1010
Broiler-Type Chicks Placed States and United States: 2016
State
April 16, 2016
April 23, 2016
April 30, 2016
Week ending
May 7, 2016
(1,000 chicks) (1,000 chicks) (1,000 chicks) (1,000 chicks)
Alabama ............. Florida ................ Georgia .............. South Carolina....
21,558 1,155
27,698 4,899
20,443 1,142
28,369 5,078
20,843 1,137
27,976 4,669
20,980 1,138
28,464 5,257
May 14, 2016
(1,000 chicks)
21,436 1,141
27,446 5,015
May 21, 2016
(1,000 chicks)
22,390 1,157
27,368 5,108
Percent of previous year
(percent)
101 83
101 94
19 State total ......
170,166
171,220
171,520
170,581
171,667
171,995
99
United States ......
177,248
178,143
178,147
177,490
178,364
179,249
100
Source: USDA National Agricultural Statistics Service, Broiler Hatchery, May 25, 2016. For additional information, the full report can be viewed at http://usda.mannlib.cornell.edu/MannUsda/viewDocumentInfo.do?documentID=1010
USDA is an equal opportunity provider and employer. All NASS reports are available, at no cost, on the NASS website: http://www.nass.usda.gov
Broiler-Type Eggs Set 19 Selected States and United States: 2016
State
April 16, 2016
April 23, 2016
Week ending
April 30, 2016
May 7, 2016
(1,000 eggs)
(1,000 eggs)
(1,000 eggs)
(1,000 eggs)
Alabama ............................................. Arkansas ............................................ Delaware ............................................ Florida ................................................ Georgia .............................................. Kentucky ............................................. Louisiana ............................................ Maryland ............................................. Mississippi .......................................... Missouri ..............................................
27,892 22,262
4,984 1,225 35,213 7,892 3,772 8,123 17,679 8,117
28,655 22,036
4,892 1,225 34,589 8,090 3,695 8,174 18,120 7,526
28,833 22,000
5,071 1,225 34,061 7,369 3,695 8,091 18,032 7,852
28,972 22,520
5,075 1,225 33,888 8,345 3,712 8,070 17,975 7,400
North Carolina .................................... Oklahoma ........................................... Pennsylvania ...................................... South Carolina .................................... Texas ................................................. Virginia ............................................... California, Tennessee,
and West Virginia ..............................
20,889 6,576 4,846 5,529
15,425 6,571
10,573
20,694 6,749 4,651 5,333
15,661 6,587
12,086
19,964 6,851 4,762 5,450
15,503 6,604
12,561
20,661 6,581 4,506 5,554
15,617 6,634
12,484
19 State total ...................................... Percent of previous year .....................
207,568 99
208,763 101
207,924 99
209,219 99
Other States .......................................
8,299
8,758
8,838
8,192
United States ...................................... Percent of previous year .....................
215,867 99
217,521 101
216,762 99
217,411 99
May 14, 2016
(1,000 eggs)
28,312 22,878
5,066 1,225 34,472 6,798 3,620 7,879 17,932 7,627
20,920 6,826 4,693 5,481
15,701 6,631
12,527
208,588 99
8,490
217,078 99
May 21, 2016
(1,000 eggs)
28,674 22,416
4,883 1,225 34,740 8,145 3,651 8,163 18,169 8,083
21,718 6,439 4,707 5,491
15,846 6,576
12,229
211,155 101
8,657
219,812 101
Broiler-Type Chicks Placed 19 Selected States and United States: 2016
State
April 16, 2016
April 23, 2016
Week ending
April 30, 2016
May 7, 2016
(1,000 chicks) (1,000 chicks) (1,000 chicks) (1,000 chicks)
Alabama ............................................. Arkansas ............................................ Delaware ............................................ Florida ................................................ Georgia .............................................. Kentucky ............................................. Louisiana ............................................ Maryland ............................................. Mississippi .......................................... Missouri ..............................................
21,558 19,699
4,374 1,155 27,698 6,123 2,980 6,087 14,541 5,568
20,443 20,547
4,731 1,142 28,369 6,204 3,069 6,978 15,191 5,512
20,843 20,458
4,505 1,137 27,976 6,384 3,185 7,350 15,038 6,041
20,980 20,743
5,345 1,138 28,464 6,182 3,251 6,252 14,704 5,947
May 14, 2016
(1,000 chicks)
21,436 19,671
5,185 1,141 27,446 6,864 3,246 6,404 15,180 5,953
May 21, 2016
(1,000 chicks)
22,390 21,142
6,444 1,157 27,368 5,956 3,279 5,104 14,737 5,735
North Carolina .................................... Oklahoma ........................................... Pennsylvania ...................................... South Carolina .................................... Texas ................................................. Virginia ............................................... California, Tennessee,
and West Virginia ..............................
17,539 4,690 3,630 4,899
12,740 5,780
11,105
17,115 4,588 3,521 5,078
12,942 4,790
11,000
16,895 3,906 3,632 4,669
12,779 5,537
11,185
16,511 4,212 3,749 5,257
12,707 5,518
9,621
16,436 4,211 3,586 5,015
13,056 5,832
11,005
16,285 3,437 3,715 5,108
12,924 5,798
11,416
19 State total ...................................... Percent of previous year .....................
170,166 99
171,220 99
171,520 99
170,581 99
171,667 100
171,995 99
Other States .......................................
7,082
6,923
6,627
6,909
6,697
7,254
United States ...................................... Percent of previous year .....................
177,248 100
178,143 100
178,147 99
177,490 99
178,364 100
179,249 100
USDA is an equal opportunity provider and employer. All NASS reports are available, at no cost, on the NASS website: http://www.nass.usda.gov