United States Department of Agriculture National Agricultural Statistics Service
Southern Region News Release Broiler Hatchery
Cooperating with the Alabama Department of Agriculture and Industries, Florida Department of Agriculture and Consumer Services, Georgia Department of Agriculture, and South Carolina Department of Agriculture
Southern Regional Field Office 355 East Hancock Avenue, Suite 100 Athens, GA 30601 (706) 546-2236 www.nass.usda.gov
March 9, 2016
Media Contact: Jim Ewing
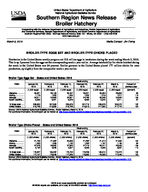
BROILER-TYPE EGGS SET AND BROILER-TYPE CHICKS PLACED
Hatcheries in the United States weekly program set 218 million eggs in incubators during the week ending March 5, 2016. This is up 2 percent from the eggs set the corresponding week a year earlier. Average hatchability for chicks hatched during the week in the United States was 84 percent. Broiler growers in the United States placed 177 million chicks for meat production, up slightly from the comparable week a year earlier.
Broiler-Type Eggs Set States and United States: 2016
State
Alabama ............. Florida ................ Georgia .............. South Carolina....
January 30, 2016
(1,000 eggs)
29,621 1,175
34,811 5,539
February 6, 2016
(1,000 eggs)
29,156 1,220
34,658 5,421
February 13, 2016
(1,000 eggs)
29,447 1,220
34,501 5,576
Week ending
February 20, 2016
(1,000 eggs)
29,021 1,220
34,789 4,990
February 27, 2016
(1,000 eggs)
29,094 1,218
35,045 5,570
March 5, 2016
(1,000 eggs)
28,684 1,217
34,632 5,411
Percent of previous year
(percent)
98 114 106
97
19 State total ......
208,803
207,363
208,676
207,719
208,975
209,373
102
United States ......
216,748
215,559
216,728
215,815
217,090
217,773
102
Source: USDA National Agricultural Statistics Service, Broiler Hatchery, March 9, 2016. For additional information, the full report can be viewed at http://usda.mannlib.cornell.edu/MannUsda/viewDocumentInfo.do?documentID=1010
Broiler-Type Chicks Placed States and United States: 2016
State
January 30, 2016
February 6, 2016
February 13, 2016
Week ending
February 20, 2016
(1,000 chicks) (1,000 chicks) (1,000 chicks) (1,000 chicks)
Alabama ............. Florida ................ Georgia .............. South Carolina....
21,739 1,283
27,576 5,152
21,562 1,238
26,800 4,549
20,936 1,143
27,823 4,937
21,292 1,252
27,719 4,535
February 27, 2016
(1,000 chicks)
21,314 1,187
28,417 4,338
March 5, 2016
(1,000 chicks)
21,500 1,145
28,005 4,957
Percent of previous year
(percent)
100 84
106 110
19 State total ......
170,527
169,432
170,744
170,236
169,510
170,474
100
United States ......
177,107
176,049
177,029
176,890
176,308
177,045
100
Source: USDA National Agricultural Statistics Service, Broiler Hatchery, March 9, 2016. For additional information, the full report can be viewed at http://usda.mannlib.cornell.edu/MannUsda/viewDocumentInfo.do?documentID=1010
USDA is an equal opportunity provider and employer. All NASS reports are available, at no cost, on the NASS website: http://www.nass.usda.gov
Broiler-Type Eggs Set 19 Selected States and United States: 2016
State
January 30, 2016
February 6, 2016
Week ending
February 13, 2016
February 20, 2016
(1,000 eggs)
(1,000 eggs)
(1,000 eggs)
(1,000 eggs)
Alabama ............................................ Arkansas ............................................ Delaware ............................................ Florida ............................................... Georgia .............................................. Kentucky ............................................. Louisiana ............................................ Maryland ............................................. Mississippi .......................................... Missouri ..............................................
29,621 21,767
4,741 1,175 34,811 7,934 3,726 7,333 18,051 8,071
29,156 21,231
4,759 1,220 34,658 7,992 3,788 7,854 17,933 7,961
29,447 21,648
4,816 1,220 34,501 8,024 3,803 7,788 17,948 8,008
29,021 22,156
4,741 1,220 34,789 8,052 3,712 7,505 17,494 7,913
North Carolina .................................... Oklahoma ........................................... Pennsylvania ...................................... South Carolina .................................. Texas ................................................. Virginia ............................................... California, Tennessee,
and West Virginia ..............................
21,145 7,036 4,555 5,539
15,231 5,941
12,126
20,907 6,748 4,975 5,421
15,396 6,340
11,024
21,144 7,006 4,817 5,576
15,272 6,344
11,314
20,980 6,872 4,642 4,990
15,420 6,383
11,829
19 State total ...................................... Percent of previous year .....................
208,803 102
207,363 100
208,676 100
207,719 100
Other States .......................................
7,945
8,196
8,052
8,096
United States ...................................... Percent of previous year .....................
216,748 102
215,559 100
216,728 100
215,815 100
February 27, 2016
(1,000 eggs)
29,094 21,975
4,827 1,218 35,045 8,017 3,697 7,662 17,648 8,010
21,281 6,659 4,674 5,570
15,463 6,408
11,727
208,975 101
8,115
217,090 101
March 5, 2016
(1,000 eggs)
28,684 22,139
4,777 1,217 34,632 8,029 3,651 7,541 17,881 7,984
21,243 6,712 4,737 5,411
15,535 6,745
12,455
209,373 102
8,400
217,773 102
Broiler-Type Chicks Placed 19 Selected States and United States: 2016
State
January 30, 2016
February 6, 2016
Week ending
February 13, 2016
February 20, 2016
(1,000 chicks) (1,000 chicks) (1,000 chicks) (1,000 chicks)
Alabama ............................................ Arkansas ............................................ Delaware ............................................ Florida ............................................... Georgia .............................................. Kentucky ............................................. Louisiana ............................................ Maryland ............................................. Mississippi .......................................... Missouri ..............................................
21,739 19,569
5,725 1,283 27,576 6,062 2,997 6,561 15,142 5,675
21,562 19,533
4,303 1,238 26,800 6,207 3,028 7,137 15,043 6,163
20,936 21,166
4,803 1,143 27,823 5,993 2,969 6,441 15,239 5,138
21,292 20,051
5,178 1,252 27,719 5,985 3,182 6,889 15,188 5,887
February 27, 2016
(1,000 chicks)
21,314 19,647
4,837 1,187 28,417 6,329 3,271 5,765 15,078 5,034
March 5, 2016
(1,000 chicks)
21,500 19,123
5,053 1,145 28,005 6,560 3,271 6,085 15,160 6,629
North Carolina .................................... Oklahoma ........................................... Pennsylvania ...................................... South Carolina .................................. Texas ................................................. Virginia ............................................... California, Tennessee,
and West Virginia ..............................
15,993 4,912 3,913 5,152
11,852 5,085
11,291
16,366 4,737 3,987 4,549
12,332 6,079
10,368
16,694 3,925 3,391 4,937
12,571 5,430
12,145
17,026 4,675 3,628 4,535
12,466 4,301
10,982
16,694 5,259 3,881 4,338
12,749 5,691
10,019
16,614 4,372 3,769 4,957
12,753 5,638
9,840
19 State total ...................................... Percent of previous year .....................
170,527 101
169,432 100
170,744 102
170,236 101
169,510 101
170,474 100
Other States .......................................
6,580
6,617
6,285
6,654
6,798
6,571
United States ...................................... Percent of previous year .....................
177,107 101
176,049 101
177,029 102
176,890 102
176,308 101
177,045 100
Source: USDA National Agricultural Statistics Service Broiler Hatchery, March 9, 2016. For additional information, the full report can be viewed at http://usda.mannlib.cornell.edu/MannUsda/viewDocumentInfo.do?documentID=1010
USDA is an equal opportunity provider and employer. All NASS reports are available, at no cost, on the NASS website: http://www.nass.usda.gov
