- Collection:
- Georgia Government Publications
- Serial:
- Broiler hatchery news release / United States Department of Agriculture National Agricultural Statistics Service.
- Title:
- Southern region broiler hatchery news release [Dec. 21, 2016]
- Creator:
- Georgia. Agricultural Statistics Service
- Contributor to Resource:
- Georgia. Agricultural Statistics Service
- Publisher:
- Athens, GA : Georgia. Agricultural Statistics Service
- Date of Original:
- 2016-12-21
- Subject:
- Georgia
- Location:
- United States, Georgia, 32.75042, -83.50018
- Medium:
- publications (documents)
- Type:
- Text
- Format:
- application/pdf
- Description:
- Began with: August 28, 2013.
Effective March 12, 2014, name of issuing body appears as Southern Regional Field Office.
August 28, 2013; title from caption (Georgia Government Publications database, viewed January 19, 2018).
January 17, 2018 (received via e-mail on January 18, 2018 from Georgia Department of Agriculture); (Georgia Government Publications database, viewed November 22, 2017). - External Identifiers:
- Call Number GA A400.C7 P1 H2 2016/12-21
- Metadata URL:
- https://dlg.galileo.usg.edu/id:dlg_ggpd_i-ga-ba400-pc7-bp1-bh2-b2016-s12-h21-belec-p-btext
- Digital Object URL:
- https://dlg.galileo.usg.edu/do:dlg_ggpd_i-ga-ba400-pc7-bp1-bh2-b2016-s12-h21-belec-p-btext
- Language:
- eng
- Holding Institution:
- University of Georgia. Map and Government Information Library
- Rights:
-

United States Department of Agriculture National Agricultural Statistics Service
Southern Region News Release Broiler Hatchery
Cooperating with the Alabama Department of Agriculture and Industries, Florida Department of Agriculture and Consumer Services, Georgia Department of Agriculture, and South Carolina Department of Agriculture
Southern Regional Field Office 355 East Hancock Avenue, Suite 100 Athens, GA 30601 (706) 546-2236 www.nass.usda.gov
December 21, 2016
Media Contact: Jim Ewing
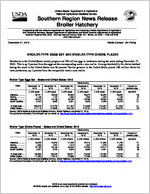
BROILER-TYPE EGGS SET AND BROILER-TYPE CHICKS PLACED
Hatcheries in the United States weekly program set 220 million eggs in incubators during the week ending December 17, 2016. This is up 2 percent from the eggs set the corresponding week a year earlier. Average hatchability for chicks hatched during the week in the United States was 84 percent. Broiler growers in the United States placed 180 million chicks for meat production, up 1 percent from the comparable week a year earlier.
Broiler-Type Eggs Set States and United States: 2016
State
Alabama ............. Florida ................ Georgia .............. South Carolina....
November 12, 2016
(1,000 eggs)
29,721 1,148
34,372 5,764
November 19, 2016
(1,000 eggs)
29,359 1,187
34,168 5,582
November 26, 2016
(1,000 eggs)
29,835 1,205
34,749 5,521
Week ending
December 3, 2016
(1,000 eggs)
29,872 1,220
34,266 5,540
December 10, 2016
(1,000 eggs)
29,920 1,224
33,803 5,455
December 17, 2016
(1,000 eggs)
29,983 1,193
34,335 5,754
Percent of previous year
(percent)
100 97
101 101
19 State total ......
208,376
210,733
211,237
210,936
210,537
211,533
101
United States ......
217,115
219,653
220,162
219,761
219,407
220,473
102
Source: USDA National Agricultural Statistics Service, Broiler Hatchery, December 21, 2016. For additional information, the full report can be viewed at http://usda.mannlib.cornell.edu/MannUsda/viewDocumentInfo.do?documentID=1010
Broiler-Type Chicks Placed States and United States: 2016
State
November 12, 2016
November 19, 2016
November 26, 2016
Week ending
December 3, 2016
(1,000 chicks) (1,000 chicks) (1,000 chicks) (1,000 chicks)
Alabama ............. Florida ................ Georgia .............. South Carolina....
20,938 1,355
27,182 4,407
20,320 1,257
26,180 4,754
21,848 1,218
26,230 4,964
22,416 1,307
27,223 5,562
December 10, 2016
(1,000 chicks)
21,855 1,278
27,317 5,421
December 17, 2016
(1,000 chicks)
21,708 1,332
28,880 3,988
Percent of previous year
(percent)
101 97
105 86
19 State total ......
164,695
165,443
168,201
170,546
172,463
172,675
101
United States ......
171,395
172,410
174,866
177,489
179,399
179,709
101
Source: USDA National Agricultural Statistics Service, Broiler Hatchery, December 21, 2016. For additional information, the full report can be viewed at http://usda.mannlib.cornell.edu/MannUsda/viewDocumentInfo.do?documentID=1010
USDA is an equal opportunity provider and employer. All NASS reports are available, at no cost, on the NASS website: http://www.nass.usda.gov
Broiler-Type Eggs Set 19 Selected States and United States: 2016
State
November 12, 2016
November 19, 2016
Week ending
November 26, 2016
December 3, 2016
(1,000 eggs)
(1,000 eggs)
(1,000 eggs)
(1,000 eggs)
Alabama ............................................ Arkansas ............................................ Delaware ............................................ Florida ............................................... Georgia .............................................. Kentucky ............................................. Louisiana ............................................ Maryland ............................................. Mississippi .......................................... Missouri ..............................................
29,721 21,852
4,966 1,148 34,372 7,516 3,470 7,865 16,815 8,200
29,359 22,853
4,999 1,187 34,168 7,719 3,485 8,152 17,540 8,186
29,835 22,973
5,035 1,205 34,749 7,613 3,667 7,930 17,339 8,186
29,872 22,611
5,052 1,220 34,266 7,689 3,833 8,065 17,373 8,171
December 10, 2016
(1,000 eggs)
29,920 22,637
5,101 1,224 33,803 7,671 3,833 8,086 17,571 8,167
December 17, 2016
(1,000 eggs)
29,983 22,634
5,054 1,193 34,335 7,392 3,833 8,140 17,586 8,157
North Carolina .................................... Oklahoma ........................................... Pennsylvania ...................................... South Carolina .................................. Texas ................................................. Virginia ............................................... California, Tennessee,
and West Virginia ..............................
20,881 7,269 4,481 5,764
15,771 6,447
11,838
21,360 7,587 4,518 5,582
15,511 6,479
12,048
20,666 7,389 4,788 5,521
15,763 6,435
12,143
20,727 7,404 4,790 5,540
15,803 6,474
12,046
20,792 7,482 4,542 5,455
15,946 6,504
11,803
20,703 7,619 4,678 5,754
15,955 6,498
12,019
19 State total ...................................... Percent of previous year .....................
208,376 101
210,733 101
211,237 101
210,936 104
210,537 102
211,533 101
Other States .......................................
8,739
8,920
8,925
8,825
8,870
8,940
United States ...................................... Percent of previous year .....................
217,115 101
219,653 101
220,162 102
219,761 105
219,407 102
220,473 102
Broiler-Type Chicks Placed 19 Selected States and United States: 2016
State
November 12, 2016
November 19, 2016
Week ending
November 26, 2016
December 3, 2016
(1,000 chicks) (1,000 chicks) (1,000 chicks) (1,000 chicks)
Alabama ............................................ Arkansas ............................................ Delaware ............................................ Florida ............................................... Georgia .............................................. Kentucky ............................................. Louisiana ............................................ Maryland ............................................. Mississippi .......................................... Missouri ..............................................
20,938 20,481
5,293 1,355 27,182 5,266 2,797 4,676 14,614 4,862
20,320 20,679
5,675 1,257 26,180 5,658 2,627 6,042 14,503 5,316
21,848 20,185
5,452 1,218 26,230 6,041 2,865 6,606 13,863 5,442
22,416 20,240
5,278 1,307 27,223 5,654 2,994 6,324 14,079 5,904
December 10, 2016
(1,000 chicks)
21,855 20,824
5,345 1,278 27,317 6,211 3,041 6,285 14,778 6,600
December 17, 2016
(1,000 chicks)
21,708 21,712
5,488 1,332 28,880 6,288 3,191 5,794 14,704 6,039
North Carolina .................................... Oklahoma ........................................... Pennsylvania ...................................... South Carolina .................................. Texas ................................................. Virginia ............................................... California, Tennessee,
and West Virginia ..............................
16,508 4,378 3,586 4,407
12,776 5,734
9,842
16,907 3,709 3,597 4,754
12,632 4,932
10,655
16,212 4,275 4,003 4,964
12,478 5,487
11,032
16,232 4,906 3,722 5,562
12,976 5,271
10,458
16,348 3,963 3,493 5,421
13,053 5,850
10,801
16,054 3,920 3,704 3,988
13,142 6,315
10,416
19 State total ...................................... Percent of previous year .....................
164,695 103
165,443 103
168,201 103
170,546 100
172,463 101
172,675 101
Other States .......................................
6,700
6,967
6,665
6,943
6,936
7,034
United States ...................................... Percent of previous year .....................
171,395 103
172,410 103
174,866 104
177,489 101
179,399 101
179,709 101
Source: USDA National Agricultural Statistics Service, Broiler Hatchery, December 21, 2016. For additional information, the full report can be viewed at http://usda.mannlib.cornell.edu/MannUsda/viewDocumentInfo.do?documentID=1010
USDA is an equal opportunity provider and employer. All NASS reports are available, at no cost, on the NASS website: http://www.nass.usda.gov