- Collection:
- Georgia Government Publications
- Serial:
- Broiler hatchery news release / United States Department of Agriculture National Agricultural Statistics Service.
- Title:
- Southern region broiler hatchery news release [Dec. 14, 2016]
- Creator:
- Georgia. Agricultural Statistics Service
- Contributor to Resource:
- Georgia. Agricultural Statistics Service
- Publisher:
- Athens, GA : Georgia. Agricultural Statistics Service
- Date of Original:
- 2016-12-14
- Subject:
- Georgia
- Location:
- United States, Georgia, 32.75042, -83.50018
- Medium:
- publications (documents)
- Type:
- Text
- Format:
- application/pdf
- Description:
- Began with: August 28, 2013.
Effective March 12, 2014, name of issuing body appears as Southern Regional Field Office.
August 28, 2013; title from caption (Georgia Government Publications database, viewed January 19, 2018).
January 17, 2018 (received via e-mail on January 18, 2018 from Georgia Department of Agriculture); (Georgia Government Publications database, viewed November 22, 2017). - External Identifiers:
- Call Number GA A400.C7 P1 H2 2016/12-14
- Metadata URL:
- https://dlg.galileo.usg.edu/id:dlg_ggpd_i-ga-ba400-pc7-bp1-bh2-b2016-s12-h14-belec-p-btext
- Digital Object URL:
- https://dlg.galileo.usg.edu/do:dlg_ggpd_i-ga-ba400-pc7-bp1-bh2-b2016-s12-h14-belec-p-btext
- Language:
- eng
- Holding Institution:
- University of Georgia. Map and Government Information Library
- Rights:
-

United States Department of Agriculture National Agricultural Statistics Service
Southern Region News Release Broiler Hatchery
Cooperating with the Alabama Department of Agriculture and Industries, Florida Department of Agriculture and Consumer Services, Georgia Department of Agriculture, and South Carolina Department of Agriculture
Southern Regional Field Office 355 East Hancock Avenue, Suite 100 Athens, GA 30601 (706) 546-2236 www.nass.usda.gov
December 14, 2016
Media Contact: Jim Ewing
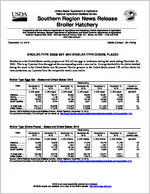
BROILER-TYPE EGGS SET AND BROILER-TYPE CHICKS PLACED
Hatcheries in the United States weekly program set 219 million eggs in incubators during the week ending December 10, 2016. This is up 2 percent from the eggs set the corresponding week a year earlier. Average hatchability for chicks hatched during the week in the United States was 84 percent. Broiler growers in the United States placed 179 million chicks for meat production, up 1 percent from the comparable week a year earlier.
Broiler-Type Eggs Set States and United States: 2016
State
Alabama ............. Florida ................ Georgia .............. South Carolina....
November 5, 2016
(1,000 eggs)
29,352 1,223
33,569 5,195
November 12, 2016
(1,000 eggs)
29,721 1,148
34,372 5,764
November 19, 2016
(1,000 eggs)
29,359 1,187
34,168 5,582
Week ending
November 26, 2016
(1,000 eggs)
29,835 1,205
34,749 5,521
December 3, 2016
(1,000 eggs)
29,891 1,220
34,266 5,539
December 10, 2016
(1,000 eggs)
29,765 1,224
33,808 5,473
Percent of previous year
(percent)
101 100 100 105
19 State total ......
204,112
208,289
210,678
210,935
211,005
210,092
101
United States ......
212,535
217,028
219,568
219,899
219,830
218,860
102
Source: USDA National Agricultural Statistics Service, Broiler Hatchery, December 14, 2016. For additional information, the full report can be viewed at http://usda.mannlib.cornell.edu/MannUsda/viewDocumentInfo.do?documentID=1010
Broiler-Type Chicks Placed States and United States: 2016
State
November 5, 2016
November 12, 2016
November 19, 2016
Week ending
November 26, 2016
(1,000 chicks) (1,000 chicks) (1,000 chicks) (1,000 chicks)
Alabama ............. Florida ................ Georgia .............. South Carolina....
20,958 1,199
26,323 4,543
20,938 1,355
27,182 4,407
20,320 1,257
26,180 4,754
21,848 1,218
26,230 4,964
December 3, 2016
(1,000 chicks)
22,475 1,287
27,223 5,558
December 10, 2016
(1,000 chicks)
21,766 1,173
27,304 5,424
Percent of previous year
(percent)
100 91
101 104
19 State total ......
164,466
164,733
165,498
168,154
170,577
172,311
101
United States ......
171,178
171,433
172,465
174,819
177,520
179,254
101
Source: USDA National Agricultural Statistics Service, Broiler Hatchery, December 14, 2016. For additional information, the full report can be viewed at http://usda.mannlib.cornell.edu/MannUsda/viewDocumentInfo.do?documentID=1010
USDA is an equal opportunity provider and employer. All NASS reports are available, at no cost, on the NASS website: http://www.nass.usda.gov
Broiler-Type Eggs Set 19 Selected States and United States: 2016
State
November 5, 2016
November 12, 2016
Week ending
November 19, November 26,
2016
2016
(1,000 eggs)
(1,000 eggs)
(1,000 eggs)
(1,000 eggs)
Alabama ............................................ Arkansas ............................................ Delaware ............................................ Florida ............................................... Georgia .............................................. Kentucky ............................................. Louisiana ............................................ Maryland ............................................. Mississippi .......................................... Missouri ..............................................
29,352 21,616
4,971 1,223 33,569 7,025 3,213 7,957 16,471 7,124
29,721 21,852
4,966 1,148 34,372 7,516 3,470 7,778 16,815 8,200
29,359 22,842
4,999 1,187 34,168 7,719 3,485 8,078 17,540 8,186
29,835 22,961
4,932 1,205 34,749 7,613 3,667 7,930 17,339 8,186
North Carolina .................................... Oklahoma ........................................... Pennsylvania ...................................... South Carolina .................................. Texas ................................................. Virginia ............................................... California, Tennessee,
and West Virginia ..............................
20,890 7,373 4,702 5,195
15,052 6,379
12,000
20,881 7,269 4,481 5,764
15,771 6,447
11,838
21,360 7,587 4,518 5,582
15,511 6,479
12,048
20,666 7,389 4,652 5,521
15,763 6,435
12,092
19 State total ...................................... Percent of previous year .....................
204,112 104
208,289 100
210,648 101
210,935 101
Other States .......................................
8,423
8,739
8,920
8,964
United States ...................................... Percent of previous year .....................
212,535 104
217,028 101
219,568 101
219,899 102
December 3, 2016
(1,000 eggs)
29,891 22,651
5,052 1,220 34,266 7,689 3,833 8,065 17,373 8,171
December 10, 2016
(1,000 eggs)
29,765 22,682
5,100 1,224 33,808 7,671 3,833 8,049 17,346 8,167
20,727 7,404 4,801 5,539
15,803 6,474
20,725 7,468 4,564 5,473
15,935 6,504
12,046
11,778
211,005 104
210,092 101
8,825
8,768
219,830 105
218,860 102
Broiler-Type Chicks Placed 19 Selected States and United States: 2016
State
November 5, 2016
November 12, 2016
Week ending
November 19, November 26,
2016
2016
(1,000 chicks) (1,000 chicks) (1,000 chicks) (1,000 chicks)
Alabama ............................................ Arkansas ............................................ Delaware ............................................ Florida ............................................... Georgia .............................................. Kentucky ............................................. Louisiana ............................................ Maryland ............................................. Mississippi .......................................... Missouri ..............................................
20,958 19,920
5,303 1,199 26,323 4,564 3,042 5,939 13,715 5,513
20,938 20,481
4,919 1,355 27,182 5,266 2,797 5,014 14,614 4,862
20,320 20,748
5,785 1,257 26,180 5,658 2,627 5,892 14,503 5,316
21,848 20,198
5,452 1,218 26,230 6,041 2,865 6,606 13,863 5,442
December 3, 2016
(1,000 chicks)
22,475 20,260
5,278 1,287 27,223 5,654 2,994 6,324 14,079 5,904
December 10, 2016
(1,000 chicks)
21,766 20,802
5,875 1,173 27,304 6,211 3,041 5,744 14,683 6,600
North Carolina .................................... Oklahoma ........................................... Pennsylvania ...................................... South Carolina .................................. Texas ................................................. Virginia ............................................... California, Tennessee,
and West Virginia ..............................
16,409 3,429 3,787 4,543
12,711 5,542
11,569
16,508 4,378 3,586 4,407
12,776 5,808
9,842
16,907 3,645 3,597 4,754
12,632 5,022
10,655
16,212 4,246 3,966 4,964
12,478 5,524
11,001
16,238 4,883 3,716 5,558
12,976 5,276
10,452
16,430 3,968 3,588 5,424
13,050 5,858
10,794
19 State total ...................................... Percent of previous year .....................
164,466 105
164,733 103
165,498 103
168,154 103
170,577 100
172,311 101
Other States .......................................
6,712
6,700
6,967
6,665
6,943
6,943
United States ...................................... Percent of previous year .....................
171,178 105
171,433 103
172,465 103
174,819 104
177,520 101
179,254 101
Source: USDA National Agricultural Statistics Service, Broiler Hatchery, December 14, 2016. For additional information, the full report can be viewed at http://usda.mannlib.cornell.edu/MannUsda/viewDocumentInfo.do?documentID=1010
USDA is an equal opportunity provider and employer. All NASS reports are available, at no cost, on the NASS website: http://www.nass.usda.gov