- Collection:
- Georgia Government Publications
- Serial:
- Broiler hatchery news release / United States Department of Agriculture National Agricultural Statistics Service.
- Title:
- Southern region broiler hatchery news release, 2015 June 3
- Creator:
- Georgia Crop Reporting Service
- Contributor to Resource:
- United States. National Agricultural Statistics Service. Southern Regional Field Office, issuing body.
Alabama. Department of Agriculture and Industries, issuing body.
Florida. Department of Agriculture and Consumer Services, issuing body.
Georgia. Department of Agriculture, issuing body.
South Carolina. Department of Agriculture, issuing body. - Publisher:
- Athens, Ga. : Georgia Agricultural Statistics Service
- Date of Original:
- 2015-06-03
- Subject:
- Poultry--Hatcheries--Georgia--Statistics
Eggs--Production--Georgia--Statistics - Location:
- United States, Georgia, 32.75042, -83.50018
- Medium:
- state government records
- Type:
- Text
- Format:
- application/pdf
- Description:
- Began with: August 28, 2013.
Effective March 12, 2014, name of issuing body appears as Southern Regional Field Office.
August 28, 2013; title from caption (Georgia Government Publications database, viewed January 19, 2018).
January 17, 2018 (received via e-mail on January 18, 2018 from Georgia Department of Agriculture); (Georgia Government Publications database, viewed November 22, 2017). - External Identifiers:
- Call Number GA A400.C7 P1 H2 2015/6-3
- Metadata URL:
- https://dlg.galileo.usg.edu/id:dlg_ggpd_i-ga-ba400-pc7-bp1-bh2-b2015-s6-h3-belec-p-btext
- Digital Object URL:
- https://dlg.galileo.usg.edu/do:dlg_ggpd_i-ga-ba400-pc7-bp1-bh2-b2015-s6-h3-belec-p-btext
- Language:
- eng
- Holding Institution:
- University of Georgia. Map and Government Information Library
- Rights:
-

United States Department of Agriculture National Agricultural Statistics Service
Southern Region News Release Broiler Hatchery
Cooperating with the Alabama Department of Agriculture and Industries, Florida Department of Agriculture and Consumer Services, Georgia Department of Agriculture, and South Carolina Department of Agriculture
Southern Regional Field Office 355 East Hancock Avenue, Suite 320 Athens, GA 30601 (706) 546-2236 www.nass.usda.gov
June 3, 2015
Media Contact: Jim Ewing
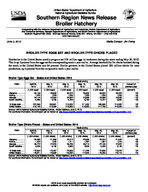
BROILER-TYPE EGGS SET AND BROILER-TYPE CHICKS PLACED
Hatcheries in the United States weekly program set 219 million eggs in incubators during the week ending May 30, 2015. This is up 2 percent from the eggs set the corresponding week a year earlier. Average hatchability for chicks hatched during the week in the United States was 84 percent. Broiler growers in the United States placed 180 million chicks for meat production, up 4 percent from the comparable week a year earlier.
Broiler-Type Eggs Set States and United States: 2015
State
Alabama ............. Florida ................ Georgia .............. South Carolina....
April 25, 2015
(1,000 eggs)
29,136 1,222
34,144 5,488
May 2, 2015
(1,000 eggs)
28,905 1,224
34,394 5,739
May 9, 2015
(1,000 eggs)
29,372 1,225
34,593 5,705
Week ending
May 16, 2015
(1,000 eggs)
29,609 1,225
34,858 5,759
May 23, 2015
(1,000 eggs)
29,603 1,225
34,085 5,707
May 30, 2015
(1,000 eggs)
29,423 1,225
34,538 5,590
Percent of previous year
(percent)
102 100 100 105
19 State total ......
207,565
209,891
210,533
211,093
209,569
210,392
102
United States ......
216,145
218,462
218,983
219,583
217,756
219,058
102
Source: USDA National Agricultural Statistics Service, Broiler Hatchery, June 3, 2015. For additional information, the full report can be viewed at http://usda.mannlib.cornell.edu/MannUsda/viewDocumentInfo.do?documentID=1010
Broiler-Type Chicks Placed States and United States: 2015
State
April 25, 2015
May 2, 2015
May 9, 2015
Week ending
May 16, 2015
(1,000 chicks) (1,000 chicks) (1,000 chicks) (1,000 chicks)
Alabama ............. Florida ................ Georgia .............. South Carolina....
22,488 1,332
26,772 4,338
21,856 1,340
27,224 5,130
22,312 1,411
26,729 4,882
22,565 1,287
26,713 4,956
May 23, 2015
(1,000 chicks)
22,204 1,397
27,109 5,408
May 30, 2015
(1,000 chicks)
21,842 1,379
27,922 5,148
Percent of previous year
(percent)
102 108 103 120
19 State total ......
172,554
173,497
172,806
171,249
172,958
173,278
104
United States ......
178,871
179,862
179,262
177,930
179,353
179,715
104
Source: USDA National Agricultural Statistics Service, Broiler Hatchery, June 3, 2015. For additional information, the full report can be viewed at http://usda.mannlib.cornell.edu/MannUsda/viewDocumentInfo.do?documentID=1010
USDA is an equal opportunity provider and employer. All NASS reports are available, at no cost, on the NASS website: http://www.nass.usda.gov
Broiler-Type Eggs Set 19 Selected States and United States: 2015
State
April 25, 2015
May 2, 2015
Week ending
May 9, 2015
May 16, 2015
(1,000 eggs)
(1,000 eggs)
(1,000 eggs)
(1,000 eggs)
Alabama ............................................ Arkansas ............................................ Delaware ............................................ Florida ............................................... Georgia .............................................. Kentucky ............................................. Louisiana ............................................ Maryland ............................................. Mississippi .......................................... Missouri ..............................................
29,136 21,549
4,717 1,222 34,144 7,891 3,833 7,723 17,310 8,127
28,905 22,173
4,743 1,224 34,394 7,854 3,878 8,054 17,621 8,105
29,372 22,127
4,759 1,225 34,593 7,815 3,878 7,984 18,022 7,759
29,609 21,717
4,774 1,225 34,858 7,836 3,848 8,068 17,974 8,328
North Carolina .................................... Oklahoma ........................................... Pennsylvania ...................................... South Carolina .................................. Texas ................................................. Virginia ............................................... California, Tennessee,
and West Virginia ..............................
21,557 6,154 4,596 5,488
15,304 6,549
12,265
21,525 6,768 4,481 5,739
15,324 6,591
12,512
21,574 6,801 4,542 5,705
15,336 6,458
12,583
21,599 6,708 4,751 5,759
15,135 6,490
12,414
19 State total ...................................... Percent of previous year .....................
207,565 102
209,891 103
210,533 103
211,093 103
Other States .......................................
8,580
8,571
8,450
8,490
United States ...................................... Percent of previous year .....................
216,145 102
218,462 103
218,983 103
219,583 103
May 23, 2015
(1,000 eggs)
29,603 21,332
4,745 1,225 34,085 8,027 3,803 8,012 18,081 8,336
21,722 6,667 4,626 5,707
15,257 6,471
11,870
209,569 102
8,187
217,756 102
May 30, 2015
(1,000 eggs)
29,423 21,722
4,748 1,225 34,538 7,983 3,787 8,029 18,057 8,298
21,759 6,491 4,644 5,590
15,264 6,495
12,339
210,392 102
8,666
219,058 102
Broiler-Type Chicks Placed 19 Selected States and United States: 2015
State
April 25, 2015
May 2, 2015
Week ending
May 9, 2015
May 16, 2015
(1,000 chicks) (1,000 chicks) (1,000 chicks) (1,000 chicks)
Alabama ............................................ Arkansas ............................................ Delaware ............................................ Florida ............................................... Georgia .............................................. Kentucky ............................................. Louisiana ............................................ Maryland ............................................. Mississippi .......................................... Missouri ..............................................
22,488 19,940
4,726 1,332 26,772 5,668 3,394 6,837 15,347 5,963
21,856 20,505
5,516 1,340 27,224 6,759 3,383 6,603 14,781 5,456
22,312 19,860
6,395 1,411 26,729 6,462 3,396 5,307 15,132 6,164
22,565 20,241
5,031 1,287 26,713 5,994 3,396 6,519 14,670 6,217
May 23, 2015
(1,000 chicks)
22,204 19,563
5,113 1,397 27,109 6,680 3,425 6,310 15,116 5,868
May 30, 2015
(1,000 chicks)
21,842 19,096
5,742 1,379 27,922 5,841 3,396 5,693 15,328 5,922
North Carolina .................................... Oklahoma ........................................... Pennsylvania ...................................... South Carolina .................................. Texas ................................................. Virginia ............................................... California, Tennessee,
and West Virginia ..............................
17,329 4,435 4,059 4,338
12,826 4,896
12,204
17,087 4,383 3,932 5,130
13,111 5,057
11,374
16,303 4,112 4,197 4,882
12,813 5,054
12,277
16,338 3,138 4,059 4,956
12,583 5,502
12,040
16,429 4,635 3,665 5,408
12,813 6,092
11,131
17,014 4,943 3,868 5,148
12,760 5,666
11,718
19 State total ...................................... Percent of previous year .....................
172,554 103
173,497 104
172,806 102
171,249 103
172,958 103
173,278 104
Other States .......................................
6,317
6,365
6,456
6,681
6,395
6,437
United States ...................................... Percent of previous year .....................
178,871 103
179,862 104
179,262 103
177,930 103
179,353 103
179,715 104
Source: USDA National Agricultural Statistics Service Broiler Hatchery, June 3, 2015. For additional information, the full report can be viewed at http://usda.mannlib.cornell.edu/MannUsda/viewDocumentInfo.do?documentID=1010
USDA is an equal opportunity provider and employer. All NASS reports are available, at no cost, on the NASS website: http://www.nass.usda.gov