- Collection:
- Georgia Government Publications
- Serial:
- Broiler hatchery news release / United States Department of Agriculture National Agricultural Statistics Service.
- Title:
- Southern region broiler hatchery news release, 2015 June 24
- Creator:
- Georgia Crop Reporting Service
- Contributor to Resource:
- United States. National Agricultural Statistics Service. Southern Regional Field Office, issuing body.
Alabama. Department of Agriculture and Industries, issuing body.
Florida. Department of Agriculture and Consumer Services, issuing body.
Georgia. Department of Agriculture, issuing body.
South Carolina. Department of Agriculture, issuing body. - Publisher:
- Athens, Ga. : Georgia Agricultural Statistics Service
- Date of Original:
- 2015-06-24
- Subject:
- Poultry--Hatcheries--Georgia--Statistics
Eggs--Production--Georgia--Statistics - Location:
- United States, Georgia, 32.75042, -83.50018
- Medium:
- state government records
- Type:
- Text
- Format:
- application/pdf
- Description:
- Began with: August 28, 2013.
Effective March 12, 2014, name of issuing body appears as Southern Regional Field Office.
August 28, 2013; title from caption (Georgia Government Publications database, viewed January 19, 2018).
January 17, 2018 (received via e-mail on January 18, 2018 from Georgia Department of Agriculture); (Georgia Government Publications database, viewed November 22, 2017). - External Identifiers:
- Call Number GA A400.C7 P1 H2 2015/6-24
- Metadata URL:
- https://dlg.galileo.usg.edu/id:dlg_ggpd_i-ga-ba400-pc7-bp1-bh2-b2015-s6-h24-belec-p-btext
- Digital Object URL:
- https://dlg.galileo.usg.edu/do:dlg_ggpd_i-ga-ba400-pc7-bp1-bh2-b2015-s6-h24-belec-p-btext
- Language:
- eng
- Holding Institution:
- University of Georgia. Map and Government Information Library
- Rights:
-

United States Department of Agriculture National Agricultural Statistics Service
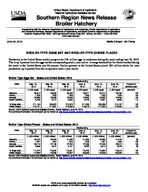
Southern Region News Release Broiler Hatchery
Cooperating with the Alabama Department of Agriculture and Industries, Florida Department of Agriculture and Consumer Services, Georgia Department of Agriculture, and South Carolina Department of Agriculture
Southern Regional Field Office 355 East Hancock Avenue, Suite 320 Athens, GA 30601 (706) 546-2236 www.nass.usda.gov
June 24, 2015
Media Contact: Jim Ewing
BROILER-TYPE EGGS SET AND BROILER-TYPE CHICKS PLACED
Hatcheries in the United States weekly program set 218 million eggs in incubators during the week ending June 20, 2015. This is up 2 percent from the eggs set the corresponding week a year earlier. Average hatchability for chicks hatched during the week in the United States was 84 percent. Broiler growers in the United States placed 180 million chicks for meat production, up 3 percent from the comparable week a year earlier.
Broiler-Type Eggs Set States and United States: 2015
State
Alabama ............. Florida ................ Georgia .............. South Carolina....
May 16, 2015
(1,000 eggs)
29,614 1,225
34,858 5,759
May 23, 2015
(1,000 eggs)
29,603 1,225
34,085 5,710
May 30, 2015
(1,000 eggs)
29,540 1,225
34,538 5,590
Week ending
June 6, 2015
(1,000 eggs)
29,571 1,225
34,559 5,726
June 13, 2015
(1,000 eggs)
29,414 1,223
34,052 5,537
June 20, 2015
(1,000 eggs)
29,709 1,224
34,296 5,683
Percent of previous year
(percent)
103 100 100 110
19 State total ......
211,154
209,922
210,573
211,339
209,386
210,187
102
United States ......
219,741
217,897
219,055
219,518
217,533
218,263
102
Source: USDA National Agricultural Statistics Service, Broiler Hatchery, June 24, 2015. For additional information, the full report can be viewed at http://usda.mannlib.cornell.edu/MannUsda/viewDocumentInfo.do?documentID=1010
Broiler-Type Chicks Placed States and United States: 2015
State
May 16, 2015
May 23, 2015
May 30, 2015
Week ending
June 6, 2015
(1,000 chicks) (1,000 chicks) (1,000 chicks) (1,000 chicks)
Alabama ............. Florida ................ Georgia .............. South Carolina....
22,570 1,287
26,713 4,956
22,204 1,397
27,109 5,410
21,842 1,379
27,793 5,151
21,993 1,346
27,406 5,252
June 13, 2015
(1,000 chicks)
22,890 1,407
27,045 4,914
June 20, 2015
(1,000 chicks)
21,979 1,392
28,312 4,578
Percent of previous year
(percent)
99 108 106
95
19 State total ......
171,274
172,920
173,341
173,725
172,982
173,618
102
United States ......
177,864
179,265
179,827
180,609
179,556
180,383
103
Source: USDA National Agricultural Statistics Service, Broiler Hatchery, June 24, 2015. For additional information, the full report can be viewed at http://usda.mannlib.cornell.edu/MannUsda/viewDocumentInfo.do?documentID=1010
USDA is an equal opportunity provider and employer. All NASS reports are available, at no cost, on the NASS website: http://www.nass.usda.gov
Broiler-Type Eggs Set 19 Selected States and United States: 2015
State
May 16, 2015
May 23, 2015
Week ending
May 30, 2015
June 6, 2015
(1,000 eggs)
(1,000 eggs)
(1,000 eggs)
(1,000 eggs)
Alabama ............................................ Arkansas ............................................ Delaware ............................................ Florida ............................................... Georgia .............................................. Kentucky ............................................. Louisiana ............................................ Maryland ............................................. Mississippi .......................................... Missouri ..............................................
29,614 21,691
4,774 1,225 34,858 7,836 3,848 8,068 17,974 8,328
29,603 21,667
4,745 1,225 34,085 8,027 3,803 8,012 18,081 8,336
29,540 21,720
4,748 1,225 34,538 7,994 3,787 8,029 18,057 8,298
29,571 22,292
4,751 1,225 34,559 7,958 3,576 8,092 18,068 8,341
North Carolina .................................... Oklahoma ........................................... Pennsylvania ...................................... South Carolina .................................. Texas ................................................. Virginia ............................................... California, Tennessee,
and West Virginia ..............................
21,599 6,708 4,751 5,759
15,135 6,490
12,496
21,771 6,667 4,626 5,710
15,257 6,471
11,836
21,759 6,491 4,692 5,590
15,264 6,495
12,346
21,859 6,679 4,711 5,726
15,228 6,495
12,208
19 State total ...................................... Percent of previous year .....................
211,154 103
209,922 102
210,573 102
211,339 103
Other States .......................................
8,587
7,975
8,482
8,179
United States ...................................... Percent of previous year .....................
219,741 103
217,897 102
219,055 102
219,518 102
June 13, 2015
(1,000 eggs)
29,414 21,602
4,757 1,223 34,052 8,041 3,848 8,019 17,834 8,310
21,524 6,674 4,615 5,537
15,017 6,412
12,507
209,386 103
8,147
217,533 102
June 20, 2015
(1,000 eggs)
29,709 21,705
4,757 1,224 34,296 7,970 3,677 8,103 17,647 8,325
21,785 6,841 4,611 5,683
14,910 6,401
12,543
210,187 102
8,076
218,263 102
Broiler-Type Chicks Placed 19 Selected States and United States: 2015
State
May 16, 2015
May 23, 2015
Week ending
May 30, 2015
June 6, 2015
(1,000 chicks) (1,000 chicks) (1,000 chicks) (1,000 chicks)
Alabama ............................................ Arkansas ............................................ Delaware ............................................ Florida ............................................... Georgia .............................................. Kentucky ............................................. Louisiana ............................................ Maryland ............................................. Mississippi .......................................... Missouri ..............................................
22,570 20,241
5,031 1,287 26,713 5,994 3,396 6,519 14,670 6,216
22,204 19,563
5,113 1,397 27,109 6,680 3,425 6,310 15,116 5,868
21,842 19,100
6,098 1,379 27,793 5,845 3,396 5,412 15,328 5,923
21,993 19,217
4,914 1,346 27,406 6,501 3,392 6,172 15,231 5,810
June 13, 2015
(1,000 chicks)
22,890 19,945
4,961 1,407 27,045 6,095 3,355 6,559 15,122 6,026
June 20, 2015
(1,000 chicks)
21,979 19,930
5,441 1,392 28,312 6,333 3,348 6,043 15,127 6,282
North Carolina .................................... Oklahoma ........................................... Pennsylvania ...................................... South Carolina .................................. Texas ................................................. Virginia ............................................... California, Tennessee,
and West Virginia ..............................
16,338 3,138 4,059 4,956
12,583 5,502
12,061
16,438 4,635 3,665 5,410
12,813 6,092
11,082
17,165 4,942 3,855 5,151
12,760 5,549
11,803
17,179 5,335 3,994 5,252
12,759 5,905
11,319
17,267 4,618 3,739 4,914
12,380 5,437
11,222
17,635 4,038 3,861 4,578
12,585 5,279
11,455
19 State total ...................................... Percent of previous year .....................
171,274 103
172,920 103
173,341 104
173,725 103
172,982 103
173,618 102
Other States .......................................
6,590
6,345
6,486
6,884
6,574
6,765
United States ...................................... Percent of previous year .....................
177,864 103
179,265 103
179,827 104
180,609 104
179,556 103
180,383 103
Source: USDA National Agricultural Statistics Service Broiler Hatchery, June 24, 2015. For additional information, the full report can be viewed at http://usda.mannlib.cornell.edu/MannUsda/viewDocumentInfo.do?documentID=1010
USDA is an equal opportunity provider and employer. All NASS reports are available, at no cost, on the NASS website: http://www.nass.usda.gov