- Collection:
- Georgia Government Publications
- Serial:
- Broiler hatchery news release / United States Department of Agriculture National Agricultural Statistics Service.
- Title:
- Southern region broiler hatchery news release, 2015 May 28
- Creator:
- Georgia Crop Reporting Service
- Contributor to Resource:
- United States. National Agricultural Statistics Service. Southern Regional Field Office, issuing body.
Alabama. Department of Agriculture and Industries, issuing body.
Florida. Department of Agriculture and Consumer Services, issuing body.
Georgia. Department of Agriculture, issuing body.
South Carolina. Department of Agriculture, issuing body. - Publisher:
- Athens, Ga. : Georgia Agricultural Statistics Service
- Date of Original:
- 2015-05-28
- Subject:
- Poultry--Hatcheries--Georgia--Statistics
Eggs--Production--Georgia--Statistics - Location:
- United States, Georgia, 32.75042, -83.50018
- Medium:
- state government records
- Type:
- Text
- Format:
- application/pdf
- Description:
- Began with: August 28, 2013.
Effective March 12, 2014, name of issuing body appears as Southern Regional Field Office.
August 28, 2013; title from caption (Georgia Government Publications database, viewed January 19, 2018).
January 17, 2018 (received via e-mail on January 18, 2018 from Georgia Department of Agriculture); (Georgia Government Publications database, viewed November 22, 2017). - External Identifiers:
- Call Number GA A400.C7 P1 H2 2015/5-28
- Metadata URL:
- https://dlg.galileo.usg.edu/id:dlg_ggpd_i-ga-ba400-pc7-bp1-bh2-b2015-s5-h28-belec-p-btext
- Digital Object URL:
- https://dlg.galileo.usg.edu/do:dlg_ggpd_i-ga-ba400-pc7-bp1-bh2-b2015-s5-h28-belec-p-btext
- Language:
- eng
- Holding Institution:
- University of Georgia. Map and Government Information Library
- Rights:
-

United States Department of Agriculture National Agricultural Statistics Service
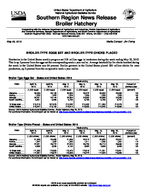
Southern Region News Release Broiler Hatchery
Cooperating with the Alabama Department of Agriculture and Industries, Florida Department of Agriculture and Consumer Services, Georgia Department of Agriculture, and South Carolina Department of Agriculture
Southern Regional Field Office 355 East Hancock Avenue, Suite 320 Athens, GA 30601 (706) 546-2236 www.nass.usda.gov
May 28, 2015
Media Contact: Jim Ewing
BROILER-TYPE EGGS SET AND BROILER-TYPE CHICKS PLACED
Hatcheries in the United States weekly program set 219 million eggs in incubators during the week ending May 23, 2015. This is up 2 percent from the eggs set the corresponding week a year earlier. Average hatchability for chicks hatched during the week in the United States was 84 percent. Broiler growers in the United States placed 180 million chicks for meat production, up 3 percent from the comparable week a year earlier.
Broiler-Type Eggs Set States and United States: 2015
State
Alabama ............. Florida ................ Georgia .............. South Carolina....
April 18, 2015
(1,000 eggs)
29,535 1,223
34,231 5,851
April 25, 2015
(1,000 eggs)
29,136 1,222
34,144 5,488
May 2, 2015
(1,000 eggs)
28,905 1,224
34,394 5,739
Week ending
May 9, 2015
(1,000 eggs)
29,372 1,225
34,593 5,705
May 16, 2015
(1,000 eggs)
29,609 1,225
34,858 5,759
May 23, 2015
(1,000 eggs)
29,588 1,225
34,085 5,707
Percent of previous year
(percent)
104 100
99 108
19 State total ......
210,218
207,578
210,242
210,403
211,353
210,376
102
United States ......
218,847
216,158
218,813
218,853
219,843
218,669
102
Source: USDA National Agricultural Statistics Service, Broiler Hatchery, May 28, 2015. For additional information, the full report can be viewed at http://usda.mannlib.cornell.edu/MannUsda/viewDocumentInfo.do?documentID=1010
Broiler-Type Chicks Placed States and United States: 2015
State
April 18, 2015
April 25, 2015
May 2, 2015
Week ending
May 9, 2015
(1,000 chicks) (1,000 chicks) (1,000 chicks) (1,000 chicks)
Alabama ............. Florida ................ Georgia .............. South Carolina....
21,325 1,327
27,021 4,689
22,488 1,332
26,772 4,338
21,856 1,340
27,224 5,130
22,312 1,411
26,729 4,882
May 16, 2015
(1,000 chicks)
22,623 1,229
26,713 4,956
May 23, 2015
(1,000 chicks)
22,337 1,397
26,969 5,408
Percent of previous year
(percent)
101 112 102 100
19 State total ......
171,083
172,555
173,473
172,816
171,251
173,291
103
United States ......
177,397
178,872
179,838
179,272
177,932
179,689
103
Source: USDA National Agricultural Statistics Service, Broiler Hatchery, May 28, 2015. For additional information, the full report can be viewed at http://usda.mannlib.cornell.edu/MannUsda/viewDocumentInfo.do?documentID=1010
USDA is an equal opportunity provider and employer. All NASS reports are available, at no cost, on the NASS website: http://www.nass.usda.gov
Broiler-Type Eggs Set 19 Selected States and United States: 2015
State
April 18, 2015
April 25, 2015
Week ending
May 2, 2015
May 9, 2015
(1,000 eggs)
(1,000 eggs)
(1,000 eggs)
(1,000 eggs)
Alabama ............................................ Arkansas ............................................ Delaware ............................................ Florida ............................................... Georgia .............................................. Kentucky ............................................. Louisiana ............................................ Maryland ............................................. Mississippi .......................................... Missouri ..............................................
29,535 21,713
4,736 1,223 34,231 7,884 3,833 7,989 17,737 8,266
29,136 21,549
4,717 1,222 34,144 7,891 3,833 7,723 17,310 8,127
28,905 22,173
4,743 1,224 34,394 7,854 3,878 8,054 17,621 8,105
29,372 22,127
4,759 1,225 34,593 7,815 3,878 7,984 18,022 7,759
North Carolina .................................... Oklahoma ........................................... Pennsylvania ...................................... South Carolina .................................. Texas ................................................. Virginia ............................................... California, Tennessee,
and West Virginia ..............................
20,780 6,672 4,878 5,851
15,538 6,553
12,799
21,570 6,154 4,596 5,488
15,304 6,549
12,265
21,486 6,768 4,481 5,739
15,327 6,591
12,899
21,565 6,801 4,542 5,705
15,336 6,458
12,462
19 State total ...................................... Percent of previous year .....................
210,218 102
207,578 102
210,242 103
210,403 103
Other States .......................................
8,629
8,580
8,571
8,450
United States ...................................... Percent of previous year .....................
218,847 102
216,158 102
218,813 103
218,853 103
May 16, 2015
(1,000 eggs)
29,609 21,717
4,774 1,225 34,858 7,836 3,848 8,068 17,974 8,328
21,601 6,708 4,751 5,759
15,135 6,490
12,672
211,353 103
8,490
219,843 103
May 23, 2015
(1,000 eggs)
29,588 21,332
4,745 1,225 34,085 8,027 3,803 8,012 18,081 8,336
21,703 6,667 4,638 5,707
15,257 6,471
12,699
210,376 102
8,293
218,669 102
Broiler-Type Chicks Placed 19 Selected States and United States: 2015
State
April 18, 2015
April 25, 2015
Week ending
May 2, 2015
May 9, 2015
(1,000 chicks) (1,000 chicks) (1,000 chicks) (1,000 chicks)
Alabama ............................................ Arkansas ............................................ Delaware ............................................ Florida ............................................... Georgia .............................................. Kentucky ............................................. Louisiana ............................................ Maryland ............................................. Mississippi .......................................... Missouri ..............................................
21,325 20,871
5,116 1,327 27,021 5,741 3,372 6,764 15,512 5,742
22,488 19,940
4,726 1,332 26,772 5,668 3,394 6,837 15,347 5,963
21,856 20,505
5,516 1,340 27,224 6,759 3,383 6,603 14,781 5,456
22,312 19,860
5,824 1,411 26,729 6,462 3,396 5,798 15,132 6,164
May 16, 2015
(1,000 chicks)
22,623 20,236
4,820 1,229 26,713 5,994 3,396 6,649 14,670 6,217
May 23, 2015
(1,000 chicks)
22,337 19,565
4,881 1,397 26,969 6,680 3,425 6,648 15,116 5,869
North Carolina .................................... Oklahoma ........................................... Pennsylvania ...................................... South Carolina .................................. Texas ................................................. Virginia ............................................... California, Tennessee,
and West Virginia ..............................
17,246 3,632 3,830 4,689
12,536 4,979
11,380
17,330 4,435 4,059 4,338
12,826 4,896
12,204
17,063 4,383 3,932 5,130
13,111 5,057
11,374
16,316 4,112 4,197 4,882
12,813 5,131
12,277
16,334 3,138 4,059 4,956
12,583 5,594
12,040
16,408 4,635 3,678 5,408
12,813 5,975
11,487
19 State total ...................................... Percent of previous year .....................
171,083 104
172,555 103
173,473 104
172,816 102
171,251 103
173,291 103
Other States .......................................
6,314
6,317
6,365
6,456
6,681
6,398
United States ...................................... Percent of previous year .....................
177,397 104
178,872 103
179,838 104
179,272 103
177,932 103
179,689 103
Source: USDA National Agricultural Statistics Service Broiler Hatchery, May 28, 2015. For additional information, the full report can be viewed at http://usda.mannlib.cornell.edu/MannUsda/viewDocumentInfo.do?documentID=1010
USDA is an equal opportunity provider and employer. All NASS reports are available, at no cost, on the NASS website: http://www.nass.usda.gov