- Collection:
- Georgia Government Publications
- Serial:
- Broiler hatchery news release / United States Department of Agriculture National Agricultural Statistics Service.
- Title:
- Southern region broiler hatchery news release, 2015 April 22
- Creator:
- Georgia Crop Reporting Service
- Contributor to Resource:
- United States. National Agricultural Statistics Service. Southern Regional Field Office, issuing body.
Alabama. Department of Agriculture and Industries, issuing body.
Florida. Department of Agriculture and Consumer Services, issuing body.
Georgia. Department of Agriculture, issuing body.
South Carolina. Department of Agriculture, issuing body. - Publisher:
- Athens, Ga. : Georgia Agricultural Statistics Service
- Date of Original:
- 2015-04-22
- Subject:
- Poultry--Hatcheries--Georgia--Statistics
Eggs--Production--Georgia--Statistics - Location:
- United States, Georgia, 32.75042, -83.50018
- Medium:
- state government records
- Type:
- Text
- Format:
- application/pdf
- Description:
- Began with: August 28, 2013.
Effective March 12, 2014, name of issuing body appears as Southern Regional Field Office.
August 28, 2013; title from caption (Georgia Government Publications database, viewed January 19, 2018).
January 17, 2018 (received via e-mail on January 18, 2018 from Georgia Department of Agriculture); (Georgia Government Publications database, viewed November 22, 2017). - External Identifiers:
- Call Number GA A400.C7 P1 H2 2015/4-22
- Metadata URL:
- https://dlg.galileo.usg.edu/id:dlg_ggpd_i-ga-ba400-pc7-bp1-bh2-b2015-s4-h22-belec-p-btext
- Digital Object URL:
- https://dlg.galileo.usg.edu/do:dlg_ggpd_i-ga-ba400-pc7-bp1-bh2-b2015-s4-h22-belec-p-btext
- Language:
- eng
- Holding Institution:
- University of Georgia. Map and Government Information Library
- Rights:
-

United States Department of Agriculture National Agricultural Statistics Service
Southern Region News Release Broiler Hatchery
Cooperating with the Alabama Department of Agriculture and Industries, Florida Department of Agriculture and Consumer Services, Georgia Department of Agriculture, and South Carolina Department of Agriculture
Southern Regional Field Office 355 East Hancock Avenue, Suite 320 Athens, GA 30601 (706) 546-2236 www.nass.usda.gov
April 22, 2015
Media Contact: Jim Ewing
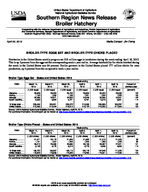
BROILER-TYPE EGGS SET AND BROILER-TYPE CHICKS PLACED
Hatcheries in the United States weekly program set 218 million eggs in incubators during the week ending April 18, 2015. This is up 2 percent from the eggs set the corresponding week a year earlier. Average hatchability for chicks hatched during the week in the United States was 84 percent. Broiler growers in the United States placed 177 million chicks for meat production, up 4 percent from the comparable week a year earlier.
Broiler-Type Eggs Set States and United States: 2015
State
Alabama ............. Florida ................ Georgia .............. South Carolina....
March 14, 2015
(1,000 eggs)
28,928 1,192
32,469 5,596
March 21, 2015
(1,000 eggs)
29,294 1,200
32,871 5,852
March 28, 2015
(1,000 eggs)
28,730 1,199
34,553 5,721
Week ending
April 4, 2015
(1,000 eggs)
29,684 1,201
34,046 5,761
April 11, 2015
(1,000 eggs)
29,024 1,222
33,855 5,516
April 18, 2015
(1,000 eggs)
29,535 1,223
34,231 5,851
Percent of previous year
(percent)
102 100 102 114
19 State total ......
205,040
205,201
208,372
210,369
209,895
209,287
102
United States ......
213,460
213,444
216,513
218,122
218,293
217,554
102
Source: USDA National Agricultural Statistics Service, Broiler Hatchery, April 22, 2015. For additional information, the full report can be viewed at http://usda.mannlib.cornell.edu/MannUsda/viewDocumentInfo.do?documentID=1010
Broiler-Type Chicks Placed States and United States: 2015
State
March 14, 2015
March 21, 2015
March 28, 2015
Week ending
April 4, 2015
(1,000 chicks) (1,000 chicks) (1,000 chicks) (1,000 chicks)
Alabama ............. Florida ................ Georgia .............. South Carolina....
21,971 1,161
26,013 5,138
22,172 1,007
25,499 4,770
21,925 1,209
25,969 6,019
21,682 1,320
26,106 4,778
April 11, 2015
(1,000 chicks)
21,919 1,455
26,387 4,849
April 18, 2015
(1,000 chicks)
21,325 1,328
27,021 4,653
Percent of previous year
(percent)
98 99 101 114
19 State total ......
169,703
169,557
168,119
168,176
167,948
171,029
104
United States ......
175,844
175,806
174,309
174,290
174,501
177,339
104
Source: USDA National Agricultural Statistics Service, Broiler Hatchery, April 22, 2015. For additional information, the full report can be viewed at http://usda.mannlib.cornell.edu/MannUsda/viewDocumentInfo.do?documentID=1010
USDA is an equal opportunity provider and employer. All NASS reports are available, at no cost, on the NASS website: http://www.nass.usda.gov
Broiler-Type Eggs Set 19 Selected States and United States: 2015
State
March 14, 2015
March 21, 2015
Week ending
March 28, 2015
April 4, 2015
(1,000 eggs)
(1,000 eggs)
(1,000 eggs)
(1,000 eggs)
Alabama ............................................ Arkansas ............................................ Delaware ............................................ Florida ............................................... Georgia .............................................. Kentucky ............................................. Louisiana ............................................ Maryland ............................................. Mississippi .......................................... Missouri ..............................................
28,928 21,865
4,829 1,192 32,469 7,766 3,817 7,937 18,001 7,904
29,294 21,083
4,578 1,200 32,871 7,651 3,833 7,581 17,841 8,310
28,730 21,991
4,670 1,199 34,553 7,718 3,833 7,838 17,935 8,229
29,684 22,057
4,670 1,201 34,046 7,684 3,833 7,856 17,728 8,212
North Carolina .................................... Oklahoma ........................................... Pennsylvania ...................................... South Carolina .................................. Texas ................................................. Virginia ............................................... California, Tennessee,
and West Virginia ..............................
21,553 6,348 4,487 5,596
13,745 6,586
12,017
21,045 6,568 4,487 5,852
14,622 6,536
11,849
21,286 6,732 4,302 5,721
15,304 6,534
11,797
21,249 6,726 4,594 5,761
15,633 6,534
12,901
19 State total ...................................... Percent of previous year .....................
205,040 101
205,201 102
208,372 103
210,369 103
Other States .......................................
8,420
8,243
8,141
7,753
United States ...................................... Percent of previous year .....................
213,460 101
213,444 102
216,513 103
218,122 103
April 11, 2015
(1,000 eggs)
29,024 21,924
4,922 1,222 33,855 7,720 3,833 7,896 17,823 8,415
21,588 6,610 4,603 5,516
15,859 6,534
12,551
209,895 102
8,398
218,293 102
April 18, 2015
(1,000 eggs)
29,535 21,696
4,736 1,223 34,231 7,884 3,833 7,989 17,567 8,266
20,733 6,672 4,647 5,851
15,538 6,553
12,333
209,287 102
8,267
217,554 102
Broiler-Type Chicks Placed 19 Selected States and United States: 2015
State
March 14, 2015
March 21, 2015
Week ending
March 28, 2015
April 4, 2015
(1,000 chicks) (1,000 chicks) (1,000 chicks) (1,000 chicks)
Alabama ............................................ Arkansas ............................................ Delaware ............................................ Florida ............................................... Georgia .............................................. Kentucky ............................................. Louisiana ............................................ Maryland ............................................. Mississippi .......................................... Missouri ..............................................
21,971 19,428
4,519 1,161 26,013 6,327 3,354 6,388 14,928 5,879
22,172 18,639
5,427 1,007 25,499 6,392 3,355 5,649 14,842 6,298
21,925 19,102
5,425 1,209 25,969 5,588 3,606 5,986 14,436 5,474
21,682 17,728
5,541 1,320 26,106 6,248 3,315 5,675 15,007 5,739
April 11, 2015
(1,000 chicks)
21,919 17,952
4,293 1,455 26,387 6,359 3,362 6,115 15,097 6,296
April 18, 2015
(1,000 chicks)
21,325 20,838
5,226 1,328 27,021 5,740 3,372 6,575 15,512 5,742
North Carolina .................................... Oklahoma ........................................... Pennsylvania ...................................... South Carolina .................................. Texas ................................................. Virginia ............................................... California, Tennessee,
and West Virginia ..............................
16,554 4,643 4,072 5,138
12,406 5,628
11,294
16,656 4,635 4,123 4,770
12,703 5,637
11,753
15,944 3,954 4,063 6,019
12,748 5,568
11,103
17,410 5,079 3,735 4,778
11,619 6,003
11,191
16,907 4,915 3,952 4,849
11,909 5,557
10,624
17,242 3,632 3,850 4,653
12,536 5,019
11,418
19 State total ...................................... Percent of previous year .....................
169,703 103
169,557 102
168,119 101
168,176 101
167,948 103
171,029 104
Other States .......................................
6,141
6,249
6,190
6,114
6,553
6,310
United States ...................................... Percent of previous year .....................
175,844 103
175,806 102
174,309 101
174,290 101
174,501 103
177,339 104
Source: USDA National Agricultural Statistics Service Broiler Hatchery, April 22, 2015. For additional information, the full report can be viewed at http://usda.mannlib.cornell.edu/MannUsda/viewDocumentInfo.do?documentID=1010
USDA is an equal opportunity provider and employer. All NASS reports are available, at no cost, on the NASS website: http://www.nass.usda.gov