- Collection:
- Georgia Government Publications
- Serial:
- Broiler hatchery news release / United States Department of Agriculture National Agricultural Statistics Service.
- Title:
- Southern region broiler hatchery news release, 2015 February 4
- Creator:
- Georgia Crop Reporting Service
- Contributor to Resource:
- United States. National Agricultural Statistics Service. Southern Regional Field Office, issuing body.
Alabama. Department of Agriculture and Industries, issuing body.
Florida. Department of Agriculture and Consumer Services, issuing body.
Georgia. Department of Agriculture, issuing body.
South Carolina. Department of Agriculture, issuing body. - Publisher:
- Athens, Ga. : Georgia Agricultural Statistics Service
- Date of Original:
- 2015-02-04
- Subject:
- Poultry--Hatcheries--Georgia--Statistics
Eggs--Production--Georgia--Statistics - Location:
- United States, Georgia, 32.75042, -83.50018
- Medium:
- state government records
- Type:
- Text
- Format:
- application/pdf
- Description:
- Began with: August 28, 2013.
Effective March 12, 2014, name of issuing body appears as Southern Regional Field Office.
August 28, 2013; title from caption (Georgia Government Publications database, viewed January 19, 2018).
January 17, 2018 (received via e-mail on January 18, 2018 from Georgia Department of Agriculture); (Georgia Government Publications database, viewed November 22, 2017). - External Identifiers:
- Call Number GA A400.C7 P1 H2 2015/2-4
- Metadata URL:
- https://dlg.galileo.usg.edu/id:dlg_ggpd_i-ga-ba400-pc7-bp1-bh2-b2015-s2-h4-belec-p-btext
- Digital Object URL:
- https://dlg.galileo.usg.edu/do:dlg_ggpd_i-ga-ba400-pc7-bp1-bh2-b2015-s2-h4-belec-p-btext
- Language:
- eng
- Holding Institution:
- University of Georgia. Map and Government Information Library
- Rights:
-

United States Department of Agriculture National Agricultural Statistics Service
Southern Region News Release Broiler Hatchery
Cooperating with the Alabama Department of Agriculture and Industries, Florida Department of Agriculture and Consumer Services, Georgia Department of Agriculture, and South Carolina Department of Agriculture
Southern Regional Field Office 355 East Hancock Avenue, Suite 320 Athens, GA 30601 (706) 546-2236 www.nass.usda.gov
February 4, 2015
Media Contact: Jim Ewing
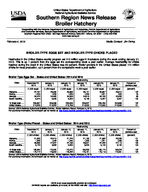
BROILER-TYPE EGGS SET AND BROILER-TYPE CHICKS PLACED
Hatcheries in the United States weekly program set 213 million eggs in incubators during the week ending January 31, 2015. This is up 1 percent from the eggs set the corresponding week a year earlier. Average hatchability for chicks hatched during the week in the United States was 83 percent. Broiler growers in the United States placed 174 million chicks for meat production, up 2 percent from the comparable week a year earlier.
Broiler-Type Eggs Set States and United States: 2014 and 2015
State
December 27, 2014
January 3, 2015
January 10, 2015
Week ending
January 17, 2015
(1,000 eggs)
(1,000 eggs)
(1,000 eggs)
(1,000 eggs)
Alabama ............. Florida ................ Georgia .............. South Carolina....
27,757 1,224
34,472 5,574
28,380 1,223
34,493 5,058
28,668 1,225
34,306 5,303
29,141 1,223
34,515 5,148
January 24, 2015
(1,000 eggs)
28,687 1,221
34,183 5,437
January 31, 2015
(1,000 eggs)
28,810 920
33,083 5,407
Percent of previous year
(percent)
102 75 98
103
19 State total ......
205,997
206,066
205,536
206,527
205,760
204,698
102
United States ......
214,220
214,222
213,756
214,333
213,553
212,500
101
Source: USDA National Agricultural Statistics Service, Broiler Hatchery Report, February 4, 2015. For additional information, the full report can be viewed at http://usda.mannlib.cornell.edu/MannUsda/viewDocumentInfo.do?documentID=1010
Broiler-Type Chicks Placed States and United States: 2014 and 2015
State
December 27, 2014
January 3, 2015
January 10, 2015
Week ending
January 17, 2015
(1,000 chicks) (1,000 chicks) (1,000 chicks) (1,000 chicks)
Alabama ............. Florida ................ Georgia .............. South Carolina....
21,925 1,328
26,889 5,124
22,413 1,342
27,027 4,582
21,724 1,340
27,168 5,230
21,189 1,355
26,541 5,023
January 24, 2015
(1,000 chicks)
21,962 1,231
27,442 5,143
January 31, 2015
(1,000 chicks)
22,338 1,365
27,113 5,120
Percent of previous year
(percent)
101 108 105 104
19 State total ......
168,364
170,050
170,070
169,206
169,174
168,024
102
United States ......
174,712
176,354
176,442
175,181
175,116
174,461
102
Source: USDA National Agricultural Statistics Service, Broiler Hatchery Report, February 4, 2015. For additional information, the full report can be viewed at http://usda.mannlib.cornell.edu/MannUsda/viewDocumentInfo.do?documentID=1010
USDA is an equal opportunity provider and employer. All NASS reports are available, at no cost, on the NASS web site: http://www.nass.usda.gov
Broiler-Type Eggs Set 19 Selected States and United States: 2014 and 2015
State
December 27, 2014
January 3, 2015
Week ending
January 10, 2015
January 17, 2015
(1,000 eggs)
(1,000 eggs)
(1,000 eggs)
(1,000 eggs)
Alabama ............................................ Arkansas ............................................ Delaware ............................................ Florida ............................................... Georgia .............................................. Kentucky ............................................. Louisiana ............................................ Maryland ............................................. Mississippi .......................................... Missouri ..............................................
27,757 21,989
4,736 1,224 34,472 7,993 3,848 7,924 17,828 8,114
28,380 21,765
4,728 1,223 34,493 8,014 3,848 7,874 17,632 8,143
28,668 21,283
4,777 1,225 34,306 7,964 3,848 7,763 17,253 8,251
29,141 21,716
4,760 1,223 34,515 8,006 3,817 7,739 17,416 8,268
North Carolina .................................... Oklahoma ........................................... Pennsylvania ...................................... South Carolina .................................. Texas ................................................. Virginia ............................................... California, Tennessee,
and West Virginia ..............................
20,687 6,189 4,370 5,574
15,036 6,455
11,801
20,965 6,270 4,330 5,058
14,967 6,634
11,742
20,844 6,613 4,382 5,303
14,872 6,590
11,594
20,878 6,260 4,395 5,148
14,990 6,590
11,665
19 State total ...................................... Percent of previous year .....................
205,997 102
206,066 103
205,536 101
206,527 103
Other States .......................................
8,223
8,156
8,220
7,806
United States ...................................... Percent of previous year .....................
214,220 102
214,222 103
213,756 102
214,333 103
January 24, 2015
(1,000 eggs)
28,687 21,176
4,773 1,221 34,183 7,877 3,727 7,695 17,993 8,256
20,563 6,611 4,364 5,437
14,985 6,407
11,805
205,760 102
7,793
213,553 102
January 31, 2015
(1,000 eggs)
28,810 21,358
4,738 920
33,083 7,670 3,863 7,572
18,020 8,227
20,990 6,384 4,235 5,407
15,266 6,434
11,721
204,698 102
7,802
212,500 101
Broiler-Type Chicks Placed 19 Selected States and United States: 2014 and 2015
State
December 27, 2014
January 3, 2015
Week ending
January 10, 2015
January 17, 2015
(1,000 chicks) (1,000 chicks) (1,000 chicks) (1,000 chicks)
Alabama ............................................ Arkansas ............................................ Delaware ............................................ Florida ............................................... Georgia .............................................. Kentucky ............................................. Louisiana ............................................ Maryland ............................................. Mississippi .......................................... Missouri ..............................................
21,925 19,483
4,775 1,328 26,889 6,135 3,307 6,496 14,415 5,927
22,413 19,317
5,770 1,342 27,027 6,012 3,427 5,931 14,985 6,551
21,724 19,179
5,567 1,340 27,168 6,455 3,230 5,634 14,947 5,998
21,189 19,009
5,201 1,355 26,541 6,291 3,414 5,711 14,907 5,266
January 24, 2015
(1,000 chicks)
21,962 18,481
5,610 1,231 27,442 6,678 3,426 5,856 14,577 6,173
January 31, 2015
(1,000 chicks)
22,338 18,989
5,061 1,365 27,113 6,125 3,407 5,978 14,190 5,647
North Carolina .................................... Oklahoma ........................................... Pennsylvania ...................................... South Carolina .................................. Texas ................................................. Virginia ............................................... California, Tennessee,
and West Virginia ..............................
16,540 4,980 4,064 5,124
11,329 5,069
10,578
16,775 4,425 3,755 4,582
11,759 5,216
10,763
16,980 4,175 3,883 5,230
12,286 5,598
10,676
16,345 5,493 3,989 5,023
12,160 5,303
12,009
16,138 4,418 3,869 5,143
12,529 5,170
10,471
16,212 4,597 4,054 5,120
12,056 5,163
10,609
19 State total ...................................... Percent of previous year .....................
168,364 102
170,050 103
170,070 103
169,206 102
169,174 103
168,024 102
Other States .......................................
6,348
6,304
6,372
5,975
5,942
6,437
United States ...................................... Percent of previous year .....................
174,712 102
176,354 103
176,442 103
175,181 102
175,116 103
174,461 102
Source: USDA National Agricultural Statistics Service Broiler Hatchery, February 4, 2015. For additional information, the full report can be viewed at http://usda.mannlib.cornell.edu/MannUsda/viewDocumentInfo.do?documentID=1010
USDA is an equal opportunity provider and employer. All NASS reports are available, at no cost, on the NASS web site: http://www.nass.usda.gov