- Collection:
- Georgia Government Publications
- Serial:
- Broiler hatchery news release / United States Department of Agriculture National Agricultural Statistics Service.
- Title:
- Southern region broiler hatchery news release, 2015 February 18
- Creator:
- Georgia Crop Reporting Service
- Contributor to Resource:
- United States. National Agricultural Statistics Service. Southern Regional Field Office, issuing body.
Alabama. Department of Agriculture and Industries, issuing body.
Florida. Department of Agriculture and Consumer Services, issuing body.
Georgia. Department of Agriculture, issuing body.
South Carolina. Department of Agriculture, issuing body. - Publisher:
- Athens, Ga. : Georgia Agricultural Statistics Service
- Date of Original:
- 2015-02-18
- Subject:
- Poultry--Hatcheries--Georgia--Statistics
Eggs--Production--Georgia--Statistics - Location:
- United States, Georgia, 32.75042, -83.50018
- Medium:
- state government records
- Type:
- Text
- Format:
- application/pdf
- Description:
- Began with: August 28, 2013.
Effective March 12, 2014, name of issuing body appears as Southern Regional Field Office.
August 28, 2013; title from caption (Georgia Government Publications database, viewed January 19, 2018).
January 17, 2018 (received via e-mail on January 18, 2018 from Georgia Department of Agriculture); (Georgia Government Publications database, viewed November 22, 2017). - External Identifiers:
- Call Number GA A400.C7 P1 H2 2015/2-18
- Metadata URL:
- https://dlg.galileo.usg.edu/id:dlg_ggpd_i-ga-ba400-pc7-bp1-bh2-b2015-s2-h18-belec-p-btext
- Digital Object URL:
- https://dlg.galileo.usg.edu/do:dlg_ggpd_i-ga-ba400-pc7-bp1-bh2-b2015-s2-h18-belec-p-btext
- Language:
- eng
- Holding Institution:
- University of Georgia. Map and Government Information Library
- Rights:
-

United States Department of Agriculture National Agricultural Statistics Service
Southern Region News Release Broiler Hatchery
Cooperating with the Alabama Department of Agriculture and Industries, Florida Department of Agriculture and Consumer Services, Georgia Department of Agriculture, and South Carolina Department of Agriculture
Southern Regional Field Office 355 East Hancock Avenue, Suite 320 Athens, GA 30601 (706) 546-2236 www.nass.usda.gov
February 18, 2015
Media Contact: Jim Ewing
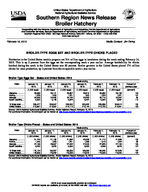
BROILER-TYPE EGGS SET AND BROILER-TYPE CHICKS PLACED
Hatcheries in the United States weekly program set 214 million eggs in incubators during the week ending February 14, 2015. This is up 3 percent from the eggs set the corresponding week a year earlier. Average hatchability for chicks hatched during the week in the United States was 83 percent. Broiler growers in the United States placed 174 million chicks for meat production, up 2 percent from the comparable week a year earlier.
Broiler-Type Eggs Set States and United States: 2015
State
Alabama ............. Florida ................ Georgia .............. South Carolina....
January 10, 2015
(1,000 eggs)
28,668 1,225
34,306 5,303
January 17, 2015
(1,000 eggs)
29,141 1,223
34,409 5,148
January 24, 2015
(1,000 eggs)
28,687 1,221
34,183 5,524
Week ending
January 31, 2015
(1,000 eggs)
28,810 920
33,083 5,447
February 7, 2015
(1,000 eggs)
28,699 1,224
33,719 5,502
February 14, 2015
(1,000 eggs)
29,158 1,221
33,367 5,567
Percent of previous year
(percent)
104 107
99 110
19 State total ......
205,477
206,547
206,300
205,302
205,886
206,512
103
United States ......
213,697
214,387
214,113
213,144
213,733
214,451
103
Source: USDA National Agricultural Statistics Service, Broiler Hatchery Report, February 18, 2015. For additional information, the full report can be viewed at http://usda.mannlib.cornell.edu/MannUsda/viewDocumentInfo.do?documentID=1010
Broiler-Type Chicks Placed States and United States: 2015
State
January 10, 2015
January 17, 2015
January 24, 2015
Week ending
January 31, 2015
(1,000 chicks) (1,000 chicks) (1,000 chicks) (1,000 chicks)
Alabama ............. Florida ................ Georgia .............. South Carolina....
21,724 1,340
27,168 5,230
21,189 1,355
26,557 5,023
21,962 1,231
27,442 5,050
22,338 1,366
27,040 5,083
February 7, 2015
(1,000 chicks)
21,710 1,518
27,625 4,266
February 14, 2015
(1,000 chicks)
21,868 1,304
27,184 4,678
Percent of previous year
(percent)
103 99
105 107
19 State total ......
170,134
169,257
169,096
168,090
168,849
167,648
102
United States ......
176,506
175,232
175,038
174,570
174,508
174,020
102
Source: USDA National Agricultural Statistics Service, Broiler Hatchery Report, February 18, 2015. For additional information, the full report can be viewed at http://usda.mannlib.cornell.edu/MannUsda/viewDocumentInfo.do?documentID=1010
USDA is an equal opportunity provider and employer. All NASS reports are available, at no cost, on the NASS web site: http://www.nass.usda.gov
Broiler-Type Eggs Set 19 Selected States and United States: 2015
State
January 10, 2015
January 17, 2015
Week ending
January 24, 2015
January 31, 2015
(1,000 eggs)
(1,000 eggs)
(1,000 eggs)
(1,000 eggs)
Alabama ............................................ Arkansas ............................................ Delaware ............................................ Florida ............................................... Georgia .............................................. Kentucky ............................................. Louisiana ............................................ Maryland ............................................. Mississippi .......................................... Missouri ..............................................
28,668 21,283
4,777 1,225 34,306 7,964 3,848 7,763 17,253 8,251
29,141 21,716
4,760 1,223 34,409 8,006 3,817 7,739 17,416 8,268
28,687 21,740
4,773 1,221 34,183 7,877 3,833 7,695 17,993 8,256
28,810 21,845
4,786 920
33,083 7,647 3,863 7,572
18,020 8,227
North Carolina .................................... Oklahoma ........................................... Pennsylvania ...................................... South Carolina .................................. Texas ................................................. Virginia ............................................... California, Tennessee,
and West Virginia ..............................
20,830 6,613 4,382 5,303
14,872 6,590
11,549
20,876 6,260 4,390 5,148
15,150 6,590
11,638
20,533 6,611 4,364 5,524
14,985 6,407
11,618
20,962 6,384 4,067 5,447
15,266 6,434
11,969
19 State total ...................................... Percent of previous year .....................
205,477 101
206,547 103
206,300 102
205,302 102
Other States .......................................
8,220
7,840
7,813
7,842
United States ...................................... Percent of previous year .....................
213,697 102
214,387 103
214,113 102
213,144 102
February 7, 2015
(1,000 eggs)
28,699 21,348
4,820 1,224 33,719 7,901 3,833 7,572 18,044 8,195
21,133 6,377 4,352 5,502
15,311 6,534
11,322
205,886 103
7,847
213,733 103
February 14, 2015
(1,000 eggs)
29,158 21,305
4,778 1,221 33,367 7,811 3,833 7,809 18,000 8,194
21,151 6,588 4,498 5,567
15,357 6,547
11,328
206,512 103
7,939
214,451 103
Broiler-Type Chicks Placed 19 Selected States and United States: 2015
State
January 10, 2015
January 17, 2015
Week ending
January 24, 2015
January 31, 2015
(1,000 chicks) (1,000 chicks) (1,000 chicks) (1,000 chicks)
Alabama ............................................ Arkansas ............................................ Delaware ............................................ Florida ............................................... Georgia .............................................. Kentucky ............................................. Louisiana ............................................ Maryland ............................................. Mississippi .......................................... Missouri ..............................................
21,724 19,179
5,567 1,340 27,168 6,455 3,230 5,634 14,947 5,998
21,189 19,009
5,201 1,355 26,557 6,291 3,414 5,711 14,907 5,266
21,962 18,481
5,610 1,231 27,442 6,678 3,426 5,856 14,577 6,173
22,338 18,937
4,951 1,366 27,040 6,118 3,407 5,915 14,180 5,746
February 7, 2015
(1,000 chicks)
21,710 19,493
4,576 1,518 27,625 7,036 3,342 6,698 14,541 5,946
February 14, 2015
(1,000 chicks)
21,868 20,226
5,030 1,304 27,184 5,577 3,342 5,948 14,635 5,429
North Carolina .................................... Oklahoma ........................................... Pennsylvania ...................................... South Carolina .................................. Texas ................................................. Virginia ............................................... California, Tennessee,
and West Virginia ..............................
16,980 4,175 3,900 5,230
12,286 5,598
10,723
16,345 5,493 3,967 5,023
12,160 5,303
12,066
16,138 4,418 3,847 5,050
12,529 5,170
10,508
16,385 4,597 4,020 5,083
12,056 5,358
10,593
16,281 3,911 3,931 4,266
11,950 5,676
10,349
16,714 3,942 3,918 4,678
11,935 4,703
11,215
19 State total ...................................... Percent of previous year .....................
170,134 103
169,257 102
169,096 103
168,090 102
168,849 103
167,648 102
Other States .......................................
6,372
5,975
5,942
6,480
5,659
6,372
United States ...................................... Percent of previous year .....................
176,506 103
175,232 102
175,038 103
174,570 103
174,508 103
174,020 102
Source: USDA National Agricultural Statistics Service Broiler Hatchery, February 18, 2015. For additional information, the full report can be viewed at http://usda.mannlib.cornell.edu/MannUsda/viewDocumentInfo.do?documentID=1010
USDA is an equal opportunity provider and employer. All NASS reports are available, at no cost, on the NASS web site: http://www.nass.usda.gov