- Collection:
- Georgia Government Publications
- Serial:
- Broiler hatchery news release / United States Department of Agriculture National Agricultural Statistics Service.
- Title:
- Southern region broiler hatchery news release, 2014 September 24
- Creator:
- Georgia Crop Reporting Service
- Contributor to Resource:
- United States. National Agricultural Statistics Service. Southern Regional Field Office, issuing body.
Alabama. Department of Agriculture and Industries, issuing body.
Florida. Department of Agriculture and Consumer Services, issuing body.
Georgia. Department of Agriculture, issuing body.
South Carolina. Department of Agriculture, issuing body. - Publisher:
- Athens, Ga. : Georgia Agricultural Statistics Service
- Date of Original:
- 2014-09-24
- Subject:
- Poultry--Hatcheries--Georgia--Statistics
Eggs--Production--Georgia--Statistics - Location:
- United States, Georgia, 32.75042, -83.50018
- Medium:
- state government records
- Type:
- Text
- Format:
- application/pdf
- Description:
- Began with: August 28, 2013.
Effective March 12, 2014, name of issuing body appears as Southern Regional Field Office.
August 28, 2013; title from caption (Georgia Government Publications database, viewed January 19, 2018).
January 17, 2018 (received via e-mail on January 18, 2018 from Georgia Department of Agriculture); (Georgia Government Publications database, viewed November 22, 2017). - External Identifiers:
- Call Number GA A400.C7 P1 H2 2014/9-24
- Metadata URL:
- https://dlg.galileo.usg.edu/id:dlg_ggpd_i-ga-ba400-pc7-bp1-bh2-b2014-s9-h24-belec-p-btext
- Digital Object URL:
- https://dlg.galileo.usg.edu/do:dlg_ggpd_i-ga-ba400-pc7-bp1-bh2-b2014-s9-h24-belec-p-btext
- Language:
- eng
- Holding Institution:
- University of Georgia. Map and Government Information Library
- Rights:
-

United States Department of Agriculture National Agricultural Statistics Service
Southern Region Broiler Hatchery News Release
Cooperating with the Alabama Department of Agriculture and Industries, Florida Department of Agriculture and Consumer Services, Georgia Department of Agriculture, and South Carolina Department of Agriculture
Southern Regional Field Office 355 East Hancock Avenue, Suite 320 Athens, GA 30601 (706) 546-2236 www.nass.usda.gov
September 24, 2014
Media Contact: Jim Ewing
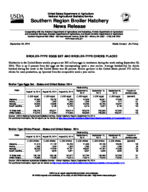
BROILER-TYPE EGGS SET AND BROILER-TYPE CHICKS PLACED
Hatcheries in the United States weekly program set 205 million eggs in incubators during the week ending September 20, 2014. This is up 3 percent from the eggs set the corresponding week a year earlier. Average hatchability for chicks hatched during the week in the United States was 83 percent. Broiler growers in the United States placed 173 million chicks for meat production, up 1percent from the comparable week a year earlier.
Broiler-Type Eggs Set States and United States: 2014
State
August 16, 2014 August 23, 2014 August 30, 2014
Alabama ............. Florida ................ Georgia .............. South Carolina....
(1,000 eggs)
27,963 1,222
34,809 5,497
(1,000 eggs)
28,733 1,222
34,589 5,166
(1,000 eggs)
28,729 1,225
34,363 5,123
Week ending
September 6, 2014
(1,000 eggs)
27,926 1,224
34,459 5,416
September 13, 2014
(1,000 eggs)
28,501 1,222
33,795 5,037
September 20, 2014
(1,000 eggs)
27,838 917
33,847 5,158
Percent of previous year
(percent)
102 101 106 103
19 State total ......
205,276
205,571
204,214
202,075
200,909
197,950
103
United States ......
213,270
213,484
212,059
209,832
208,655
205,441
103
Source : USDA National Agricultural Statistics Service, Broiler Hatchery Report, September 24, 2014. For additional information, the full report can be viewed at http://usda.mannlib.cornell.edu/MannUsda/viewDocumentInfo.do?documentID=1010
Broiler-Type Chicks Placed States and United States: 2014
State
August 16, 2014 August 23, 2014 August 30, 2014
Week ending
September 6, 2014
(1,000 chicks) (1,000 chicks) (1,000 chicks) (1,000 chicks)
Alabama ............. Florida ................ Georgia .............. South Carolina....
21,518 1,299
28,209 4,077
21,132 1,534
27,243 4,923
20,795 1,300
27,761 4,621
21,639 1,290
26,957 4,507
September 13, 2014
(1,000 chicks)
22,189 1,182
27,767 4,539
September 20, 2014
(1,000 chicks)
22,009 1,265
27,086 4,583
Percent of previous year
(percent)
108 94
100 99
19 State total ......
169,159
168,166
167,677
167,784
168,485
167,225
101
United States ......
174,968
174,382
173,613
173,814
174,543
173,250
101
Source: USDA National Agricultural Statistics Service - Broiler Hatchery Report, September 24, 2014. For additional information, report can be viewed at http://usda.mannlib.cornell.edu/MannUsda/viewDocumentInfo.do?documentID=1010
USDA is an equal opportunity provider and employer. All NASS reports are available, at no cost, on the NASS web site: http:/www.nass.usda.gov
Broiler-Type Eggs Set 19 Selected States and United States: 2014
State
August 16, 2014
August 23, 2014
Week ending
August 30, 2014
September 6, 2014
(1,000 eggs)
(1,000 eggs)
(1,000 eggs)
(1,000 eggs)
Alabama ............................................ Arkansas ............................................ Delaware ........................................... Florida ............................................... Georgia ............................................. Kentucky ............................................ Louisiana ........................................... Maryland ............................................ Mississippi ......................................... Missouri .............................................
27,963 21,550
4,516 1,222 34,809 7,920 3,817 7,489 18,088 8,472
28,733 21,553
4,567 1,222 34,589 8,020 3,817 7,579 18,017 8,474
28,729 21,592
4,400 1,225 34,363 7,823 3,787 7,806 17,536 8,354
27,926 21,725
4,416 1,224 34,459 7,836 3,787 7,218 16,743 8,533
September 13, 2014
(1,000 eggs)
28,501 21,399
4,424 1,222 33,795 7,845 3,787 7,125 17,529 8,503
September 20, 2014
(1,000 eggs)
27,838 20,107
4,473 917
33,847 7,675 3,605 7,123
16,784 7,893
North Carolina .................................... Oklahoma .......................................... Pennsylvania ..................................... South Carolina ................................. Texas ................................................. Virginia ............................................... California, Tennessee,
and West Virginia .............................
21,093 6,600 4,150 5,497
14,749 6,439
10,902
21,053 6,662 4,419 5,166
14,394 6,444
10,862
20,681 6,615 4,480 5,123
14,267 6,447
10,986
20,593 6,700 4,422 5,416
13,596 6,461
11,020
19,027 6,259 4,585 5,037
14,543 6,393
10,935
20,144 6,622 4,412 5,158
14,449 6,495
10,408
19 State total ...................................... Percent of previous year ....................
205,276 102
205,571 101
204,214 101
202,075 103
200,909 103
197,950 103
Other States .......................................
7,994
7,913
7,845
7,757
7,746
7,491
United States ..................................... Percent of previous year ....................
213,270 102
213,484 101
212,059 102
209,832 103
208,655 103
205,441 103
Broiler-Type Chicks Placed 19 Selected States and United States: 2014
State
August 16, 2014
August 23, 2014
Week ending
August 30, 2014
September 6, 2014
(1,000 chicks) (1,000 chicks) (1,000 chicks) (1,000 chicks)
Alabama ............................................ Arkansas ............................................ Delaware ........................................... Florida ............................................... Georgia ............................................. Kentucky ............................................ Louisiana ........................................... Maryland ............................................ Mississippi ......................................... Missouri .............................................
21,518 19,047
4,199 1,299 28,209 6,618 3,145 5,955 14,775 6,529
21,132 19,097
4,621 1,534 27,243 6,415 3,318 6,337 15,142 6,196
20,795 19,869
4,790 1,300 27,761 6,646 3,331 6,336 15,217 5,989
21,639 19,343
4,985 1,290 26,957 6,713 3,395 6,419 15,095 6,082
September 13, 2014
(1,000 chicks)
22,189 19,315
5,547 1,182 27,767 6,762 3,404 4,814 15,009 6,166
September 20, 2014
(1,000 chicks)
22,009 20,851
4,592 1,265 27,086 6,037 3,352 6,098 14,513 5,605
North Carolina .................................... Oklahoma .......................................... Pennsylvania ..................................... South Carolina ................................. Texas ................................................. Virginia ............................................... California, Tennessee,
and West Virginia .............................
16,849 4,371 3,641 4,077
11,894 6,187
10,846
15,813 4,501 3,511 4,923
11,994 5,495
10,894
16,588 4,033 3,519 4,621
11,913 5,395
9,574
16,317 4,342 3,349 4,507
12,289 4,673
10,389
16,250 4,387 3,545 4,539
11,988 5,868
9,753
16,337 3,706 3,776 4,583
11,318 5,396
10,701
19 State total ...................................... Percent of previous year ....................
169,159 101
168,166 102
167,677 100
167,784 101
168,485 101
167,225 101
Other States .......................................
5,809
6,216
5,936
6,030
6,058
6,025
United States ..................................... Percent of previous year ....................
174,968 101
174,382 102
173,613 100
173,814 101
174,543 101
173,250 101
Source: USDA National Agricultural Statistics Service Broiler Hatchery, September 24, 2014. For additional information, the full report can be viewed at http://usda.mannlib.cornell.edu/MannUsda/viewDocumentInfo.do?documentID=1010
USDA is an equal opportunity provider and employer. All NASS reports are available, at no cost, on the NASS web site: http:/www.nass.usda.gov