- Collection:
- Georgia Government Publications
- Serial:
- Broiler hatchery news release / United States Department of Agriculture National Agricultural Statistics Service.
- Title:
- Southern region broiler hatchery news release, 2014 March 19
- Creator:
- Georgia Crop Reporting Service
- Contributor to Resource:
- United States. National Agricultural Statistics Service. Southern Regional Field Office, issuing body.
Alabama. Department of Agriculture and Industries, issuing body.
Florida. Department of Agriculture and Consumer Services, issuing body.
Georgia. Department of Agriculture, issuing body.
South Carolina. Department of Agriculture, issuing body. - Publisher:
- Athens, Ga. : Georgia Agricultural Statistics Service
- Date of Original:
- 2014-03-19
- Subject:
- Poultry--Hatcheries--Georgia--Statistics
Eggs--Production--Georgia--Statistics - Location:
- United States, Georgia, 32.75042, -83.50018
- Medium:
- state government records
- Type:
- Text
- Format:
- application/pdf
- Description:
- Began with: August 28, 2013.
Effective March 12, 2014, name of issuing body appears as Southern Regional Field Office.
August 28, 2013; title from caption (Georgia Government Publications database, viewed January 19, 2018).
January 17, 2018 (received via e-mail on January 18, 2018 from Georgia Department of Agriculture); (Georgia Government Publications database, viewed November 22, 2017). - External Identifiers:
- Call Number GA A400.C7 P1 H2 2014/3-19
- Metadata URL:
- https://dlg.galileo.usg.edu/id:dlg_ggpd_i-ga-ba400-pc7-bp1-bh2-b2014-s3-h19-belec-p-btext
- Digital Object URL:
- https://dlg.galileo.usg.edu/do:dlg_ggpd_i-ga-ba400-pc7-bp1-bh2-b2014-s3-h19-belec-p-btext
- Language:
- eng
- Holding Institution:
- University of Georgia. Map and Government Information Library
- Rights:
-

United States Department of Agriculture National Agricultural Statistics Service
Southern Region News Release Broiler Hatchery
Cooperating with the Alabama Department of Agriculture and Industries, Florida Department of Agriculture and Consumer Services, Georgia Department of Agriculture, and South Carolina Department of Agriculture
Southern Regional Field Office 355 East Hancock Avenue, Suite 320 Athens, GA 30601 (706) 546-2236 www.nass.usda.gov
March 19, 2014
Media Contact: Jim Ewing
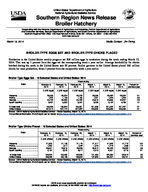
BROILER-TYPE EGGS SET AND BROILER-TYPE CHICKS PLACED
Hatcheries in the United States weekly program set 209 million eggs in incubators during the week ending March 15, 2014. This was up 1 percent from the eggs set the corresponding week a year earlier. Average hatchability for chicks hatched during the week in the United States was 83 percent. Broiler growers in the United States placed 169 million chicks for meat production, down 1 percent from the comparable week a year earlier.
Broiler-Type Eggs Set 19 Selected States and United States: 2014
State
February 8, 2014
February 15, 2014
Week ending
February 22, 2014
March 1, 2014
(1,000 eggs) (1,000 eggs) (1,000 eggs)
(1,000 eggs)
March 8, 2014
March 15, Percent of
2014
previous year
(1,000 eggs) (1,000 eggs)
Alabama .....................................
28,095
28,034
28,378
28,060
28,482
28,534
101
Florida ........................................
1,223
1,145
1,159
1,221
1,224
1,224
100
Georgia ......................................
33,734
33,599
33,442
33,619
33,696
34,237
103
South Carolina ............................
5,207
5,053
5,047
5,235
5,102
4,786
91
19 State total ...............................
199,206
199,824
199,951
201,806
201,052
201,237
101
United States..........................
207,014
207,772
207,822
209,633
208,985
209,065
101
Source: USDA National Agricultural Statistics Service Broiler Hatchery, March 19, 2014. For additional information, the full report can be viewed at http://usda.mannlib.cornell.edu/MannUsda/viewDocumentInfo.do?documentID=1010
Broiler-Type Chicks Placed 19 Selected States and United States: 2014
State
February 8, 2014
February 15, 2014
Week ending
February 22, 2014
March 1, 2014
(1,000 chicks) (1,000 chicks) (1,000 chicks) (1,000 chicks)
March 8, 2014
(1,000 chicks)
March 15, Percent of
2014
previous year
(1,000 chicks)
Alabama .....................................
21,620
21,138
21,175
21,417
21,528
21,718
102
Florida ........................................
1,250
1,317
1,542
1,379
1,218
1,366
112
Georgia ......................................
26,931
25,919
25,206
26,912
26,443
26,092
96
South Carolina ............................
4,157
4,370
4,917
4,416
4,351
4,716
121
19 State total...........................
162,934
163,460
162,509
161,408
162,560
162,812
99
United States.........................
168,538
169,196
168,604
167,626
168,407
168,731
99
Source: USDA National Agricultural Statistics Service Broiler Hatchery, March 19, 2014. For additional information, the full report can be viewed at http://usda.mannlib.cornell.edu/MannUsda/viewDocumentInfo.do?documentID=1010
USDA is an equal opportunity provider and employer. All NASS reports are available, at no cost, on the NASS web site: http://www.nass.usda.gov
Broiler-Type Eggs Set 19 Selected States and United States: 2014
State
February 8, 2014
February 15, 2014
Week ending
February 22, 2014
March 1, 2014
(1,000 eggs)
(1,000 eggs)
(1,000 eggs)
(1,000 eggs)
Alabama ............................................ Arkansas ............................................ Delaware ............................................ Florida ............................................... Georgia .............................................. Kentucky ............................................. Louisiana ............................................ Maryland ............................................. Mississippi .......................................... Missouri ..............................................
28,095 20,245
4,373 1,223 33,734 7,659 3,894 7,193 17,757 8,176
28,034 20,685
4,382 1,145 33,599 7,636 3,878 7,695 17,543 8,516
28,378 20,341
4,462 1,159 33,442 7,566 3,878 7,711 17,567 8,517
28,060 20,466
4,407 1,221 33,619 7,778 3,848 7,740 17,958 8,559
North Carolina .................................... Oklahoma ........................................... Pennsylvania ...................................... South Carolina .................................. Texas ................................................. Virginia ............................................... California, Tennessee,
and West Virginia ..............................
20,187 7,180 3,730 5,207
14,561 6,132
9,860
20,449 6,915 3,158 5,053
14,788 6,419
9,929
20,649 6,452 3,746 5,047
14,828 6,415
9,793
20,416 7,214 4,073 5,235
14,714 6,541
9,957
19 State total ...................................... Percent of previous year .....................
199,206 101
199,824 100
199,951 100
201,806 101
Other States .......................................
7,808
7,948
7,871
7,827
United States ...................................... Percent of previous year .....................
207,014 101
207,772 100
207,822 100
209,633 101
March 8, 2014
(1,000 eggs)
28,482 20,960
4,607 1,224 33,696 7,449 3,833 7,692 17,611 8,533
19,985 6,998 3,908 5,102
14,358 6,681
9,933
201,052 101
7,933
208,985 101
March 15, 2014
(1,000 eggs)
28,534 20,334
4,669 1,224 34,237 7,765 3,772 7,735 17,660 8,541
20,330 6,851 3,831 4,786
14,555 6,829
9,584
201,237 101
7,828
209,065 101
Broiler-Type Chicks Placed 19 Selected States and United States: 2014
State
February 8, 2014
February 15, 2014
Week ending
February 22, 2014
March 1, 2014
(1,000 chicks) (1,000 chicks) (1,000 chicks) (1,000 chicks)
Alabama ............................................ Arkansas ............................................ Delaware ............................................ Florida ............................................... Georgia .............................................. Kentucky ............................................. Louisiana ............................................ Maryland ............................................. Mississippi .......................................... Missouri ..............................................
21,620 19,856
5,146 1,250 26,931 5,925 3,387 5,691 14,253 6,189
21,138 20,847
4,629 1,317 25,919 6,550 3,406 6,138 14,652 5,175
21,175 18,464
5,360 1,542 25,206 5,585 3,442 5,295 14,709 6,060
21,417 18,774
4,713 1,379 26,912 5,803 3,401 5,349 14,787 4,721
March 8, 2014
(1,000 chicks)
21,528 19,532
4,539 1,218 26,443 5,787 3,397 6,006 14,638 5,958
March 15, 2014
(1,000 chicks)
21,718 19,326
4,139 1,366 26,092 6,109 3,407 6,689 14,763 5,097
North Carolina .................................... Oklahoma ........................................... Pennsylvania ...................................... South Carolina .................................. Texas ................................................. Virginia ............................................... California, Tennessee,
and West Virginia ..............................
16,085 3,514 3,222 4,157
11,631 4,837
9,240
16,292 3,792 3,163 4,370
11,697 5,027
9,348
15,793 4,879 3,354 4,917
11,776 4,671
10,281
15,305 5,001 3,163 4,416
11,982 4,862
9,423
15,897 3,803 2,614 4,351
11,846 5,460
9,543
16,372 4,483 3,054 4,716
11,713 5,008
8,760
19 State total ...................................... Percent of previous year .....................
162,934 100
163,460 100
162,509 100
161,408 99
162,560 99
162,812 99
Other States .......................................
5,604
5,736
6,095
6,218
5,847
5,919
United States ...................................... Percent of previous year .....................
168,538 100
169,196 100
168,604 100
167,626 99
168,407 99
168,731 99
Source: USDA National Agricultural Statistics Service Broiler Hatchery, March 19, 2014. For additional information, the full report can be viewed at http://usda.mannlib.cornell.edu/MannUsda/viewDocumentInfo.do?documentID=1010
USDA is an equal opportunity provider and employer. All NASS reports are available, at no cost, on the NASS web site: http://www.nass.usda.gov