- Collection:
- Georgia Government Publications
- Serial:
- Broiler hatchery news release / United States Department of Agriculture National Agricultural Statistics Service.
- Title:
- Southern region broiler hatchery news release, 2014 February 5
- Creator:
- Georgia Crop Reporting Service
- Contributor to Resource:
- United States. National Agricultural Statistics Service. Southern Regional Field Office, issuing body.
Alabama. Department of Agriculture and Industries, issuing body.
Florida. Department of Agriculture and Consumer Services, issuing body.
Georgia. Department of Agriculture, issuing body.
South Carolina. Department of Agriculture, issuing body. - Publisher:
- Athens, Ga. : Georgia Agricultural Statistics Service
- Date of Original:
- 2014-02-05
- Subject:
- Poultry--Hatcheries--Georgia--Statistics
Eggs--Production--Georgia--Statistics - Location:
- United States, Georgia, 32.75042, -83.50018
- Medium:
- state government records
- Type:
- Text
- Format:
- application/pdf
- Description:
- Began with: August 28, 2013.
Effective March 12, 2014, name of issuing body appears as Southern Regional Field Office.
August 28, 2013; title from caption (Georgia Government Publications database, viewed January 19, 2018).
January 17, 2018 (received via e-mail on January 18, 2018 from Georgia Department of Agriculture); (Georgia Government Publications database, viewed November 22, 2017). - External Identifiers:
- Call Number GA A400.C7 P1 H2 2014/2-5
- Metadata URL:
- https://dlg.galileo.usg.edu/id:dlg_ggpd_i-ga-ba400-pc7-bp1-bh2-b2014-s2-h5-belec-p-btext
- Digital Object URL:
- https://dlg.galileo.usg.edu/do:dlg_ggpd_i-ga-ba400-pc7-bp1-bh2-b2014-s2-h5-belec-p-btext
- Language:
- eng
- Holding Institution:
- University of Georgia. Map and Government Information Library
- Rights:
-

United States Department of Agriculture National Agricultural Statistics Service
Southern Region Broiler Hatchery News Release
In Cooperation with Alabama Department of Agriculture and Industries, Florida Department of Agriculture and Consumer Services, Georgia Department of Agriculture, and South Carolina Department of Agriculture
Southern Region 355 East Hancock Avenue, Suite 320 Athens, GA 30601 (706) 546-2236 www.nass.usda.gov
February 5, 2014
Media Contact: Jim Ewing nassrfosor@nass.usda.gov
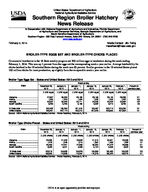
BROILER-TYPE EGGS SET AND BROILER-TYPE CHICKS PLACED
Commercial hatcheries in the 19 State weekly program set 200 million eggs in incubators during the week ending February 1, 2014. This was up 1 percent from the eggs set the corresponding week a year earlier. Average hatchability for chicks hatched in the 19 selected States during the week was 83 percent. Broiler growers in the 19 selected States placed 163 million chicks for meat production, up slightly from the comparable week a year earlier.
Broiler-Type Eggs Set States and United States: 2013 and 2014
State
December 28, 2013
January 4, 2014
Week ending
January 11, 2014
January 18, 2014
(1,000 eggs) (1,000 eggs) (1,000 eggs)
(1,000 eggs)
January 25, February 1, Percent of
2014
2014
previous year
(1,000 eggs) (1,000 eggs)
Alabama .....................................
27,857
28,038
28,188
28,196
28,140
28,298
101
Florida ........................................
1,220
1,224
1,224
1,223
1,223
1,222
100
Georgia ......................................
33,957
33,948
33,711
33,359
33,434
33,662
102
South Carolina ............................
5,255
5,249
5,169
5,362
5,210
5,249
95
19 State total ...............................
200,493
199,296
201,516
199,487
200,714
200,080
101
United States..........................
208,451
207,174
209,313
207,325
208,600
207,894
101
Source: USDA National Agricultural Statistics Service Broiler Hatchery, February 5, 2014.
Broiler-Type Chicks Placed States and United States: 2013 and 2014
State
December 28, January 4,
2013
2014
Week ending
January 11, 2014
January 18, 2014
(1,000 chicks) (1,000 chicks) (1,000 chicks) (1,000 chicks)
January 25, 2014
(1,000 chicks)
February 1, 2014
Percent of previous year
(1,000 chicks)
Alabama .....................................
22,289
21,323
20,952
21,019
20,621
22,085
105
Florida ........................................
1,278
1,349
1,210
1,350
1,439
1,262
91
Georgia ......................................
25,435
27,201
27,899
26,335
27,372
25,896
101
South Carolina ............................
4,538
5,041
4,468
5,134
4,506
4,902
109
19 State total...........................
163,918
164,639
164,224
164,586
163,463
163,332
100
United States.........................
169,983
170,808
170,267
170,376
169,322
169,273
101
Source: USDA National Agricultural Statistics Service Broiler Hatchery, February 5, 2014.
USDA is an equal opportunity provider and employer.
Broiler-Type Eggs Set 19 Selected States and United States: 2013 and 2014
State
December 28, 2013
January 4, 2014
Week ending
January 11, 2014
January 18, 2014
(1,000 eggs)
(1,000 eggs)
(1,000 eggs)
(1,000 eggs)
Alabama ............................................ Arkansas ............................................ Delaware ............................................ Florida ............................................... Georgia .............................................. Kentucky ............................................. Louisiana ............................................ Maryland ............................................. Mississippi .......................................... Missouri ..............................................
27,857 21,055
4,396 1,220 33,957 7,952 3,788 7,160 17,504 8,261
28,038 21,029
4,380 1,224 33,948 7,906 3,834 7,001 17,687 8,452
28,188 20,787
4,405 1,224 33,711 7,748 3,864 7,226 17,931 8,476
28,196 20,601
4,398 1,223 33,359 7,301 3,864 7,679 17,173 8,431
North Carolina .................................... Oklahoma ........................................... Pennsylvania ...................................... South Carolina .................................. Texas ................................................. Virginia ............................................... California, Tennessee,
and West Virginia ..............................
20,305 6,931 3,828 5,255
13,983 6,571
10,470
20,214 6,896 3,851 5,249
14,554 6,163
8,870
20,048 7,270 3,825 5,169
14,788 6,448
10,408
20,001 6,897 3,796 5,362
14,531 6,405
10,270
19 State total ...................................... Percent of previous year .....................
200,493 103
199,296 102
201,516 103
199,487 102
Other States .......................................
7,958
7,878
7,797
7,838
United States ......................................
208,451
207,174
209,313
207,325
January 25, 2014
(1,000 eggs)
28,140 20,807
4,394 1,223 33,434 7,828 3,894 7,732 17,466 8,415
20,511 7,161 3,734 5,210
14,609 6,332
9,824
200,714 102
7,886
208,600
February 1, 2014
(1,000 eggs)
28,298 20,152
4,396 1,222 33,662 7,671 3,909 7,690 17,538 8,442
20,242 6,942 3,861 5,249
14,524 6,168
10,114
200,080 101
7,814
207,894
Broiler-Type Chicks Placed 19 Selected States and United States: 2013 and 2014
State
December 28, 2013
January 4, 2014
Week ending
January 11, 2014
January 18, 2014
(1,000 chicks) (1,000 chicks) (1,000 chicks) (1,000 chicks)
Alabama ............................................ Arkansas ............................................ Delaware ............................................ Florida ............................................... Georgia .............................................. Kentucky ............................................. Louisiana ............................................ Maryland ............................................. Mississippi .......................................... Missouri ..............................................
22,289 20,344
5,223 1,278 25,435 6,408 3,317 6,119 14,678 5,895
21,323 19,126
5,263 1,349 27,201 6,330 3,324 5,970 14,846 5,164
20,952 19,450
5,059 1,210 27,899 5,539 3,241 5,288 14,813 5,896
21,019 19,213
5,402 1,350 26,335 6,445 3,292 4,805 14,842 5,717
January 25, 2014
(1,000 chicks)
20,621 19,426
4,791 1,439 27,372 6,377 3,364 5,803 14,691 5,785
February 1, 2014
(1,000 chicks)
22,085 19,618
4,788 1,262 25,896 5,914 3,370 5,724 14,971 6,228
North Carolina .................................... Oklahoma ........................................... Pennsylvania ...................................... South Carolina .................................. Texas ................................................. Virginia ............................................... California, Tennessee,
and West Virginia ..............................
15,769 3,593 3,033 4,538
11,771 4,895
9,333
15,362 5,498 3,109 5,041
11,912 4,814
9,007
15,836 4,572 3,106 4,468
11,349 5,548
9,998
16,091 4,922 3,151 5,134
11,388 5,685
9,795
16,089 4,877 3,156 4,506
11,775 5,293
8,098
15,399 4,022 2,984 4,902
11,775 4,843
9,551
19 State total ...................................... Percent of previous year .....................
163,918 103
164,639 101
164,224 100
164,586 102
163,463 100
163,332 100
Other States .......................................
6,065
6,169
6,043
5,790
5,859
5,941
United States ......................................
169,983
170,808
170,267
Source: USDA National Agricultural Statistics Service Broiler Hatchery, February 5, 2014.
170,376
169,322
169,273
USDA is an equal opportunity provider and employer.