- Collection:
- Georgia Government Publications
- Serial:
- Broiler hatchery news release / United States Department of Agriculture National Agricultural Statistics Service.
- Title:
- Southern region broiler hatchery news release, 2014 February 26
- Creator:
- Georgia Crop Reporting Service
- Contributor to Resource:
- United States. National Agricultural Statistics Service. Southern Regional Field Office, issuing body.
Alabama. Department of Agriculture and Industries, issuing body.
Florida. Department of Agriculture and Consumer Services, issuing body.
Georgia. Department of Agriculture, issuing body.
South Carolina. Department of Agriculture, issuing body. - Publisher:
- Athens, Ga. : Georgia Agricultural Statistics Service
- Date of Original:
- 2014-02-26
- Subject:
- Poultry--Hatcheries--Georgia--Statistics
Eggs--Production--Georgia--Statistics - Location:
- United States, Georgia, 32.75042, -83.50018
- Medium:
- state government records
- Type:
- Text
- Format:
- application/pdf
- Description:
- Began with: August 28, 2013.
Effective March 12, 2014, name of issuing body appears as Southern Regional Field Office.
August 28, 2013; title from caption (Georgia Government Publications database, viewed January 19, 2018).
January 17, 2018 (received via e-mail on January 18, 2018 from Georgia Department of Agriculture); (Georgia Government Publications database, viewed November 22, 2017). - External Identifiers:
- Call Number GA A400.C7 P1 H2 2014/2-26
- Metadata URL:
- https://dlg.galileo.usg.edu/id:dlg_ggpd_i-ga-ba400-pc7-bp1-bh2-b2014-s2-h26-belec-p-btext
- Digital Object URL:
- https://dlg.galileo.usg.edu/do:dlg_ggpd_i-ga-ba400-pc7-bp1-bh2-b2014-s2-h26-belec-p-btext
- Language:
- eng
- Holding Institution:
- University of Georgia. Map and Government Information Library
- Rights:
-

United States Department of Agriculture National Agricultural Statistics Service
Southern Region Broiler Hatchery News Release
In Cooperation with Alabama Department of Agriculture and Industries, Florida Department of Agriculture and Consumer Services, Georgia Department of Agriculture, and South Carolina Department of Agriculture
Southern Region 355 East Hancock Avenue, Suite 320 Athens, GA 30601 (706) 546-2236 www.nass.usda.gov
February 26, 2014
Media Contact: Jim Ewing nassrfosor@nass.usda.gov
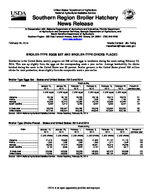
BROILER-TYPE EGGS SET AND BROILER-TYPE CHICKS PLACED
Hatcheries in the United States weekly program set 208 million eggs in incubators during the week ending February 22, 2014. This was up slightly from the eggs set the corresponding week a year earlier. Average hatchability for chicks hatched during the week in the United States was 83 percent. Broiler growers in the United States placed 169 million chicks for meat production, down slightly from the comparable week a year earlier.
Broiler-Type Eggs Set States and United States: 2013 and 2014
State
January 18, 2014
January 25, 2014
Week ending
February 1, 2014
February 8, 2014
February 15, February 22, Percent of
2014
2014
previous year
(1,000 eggs) (1,000 eggs) (1,000 eggs)
(1,000 eggs) (1,000 eggs) (1,000 eggs)
Alabama .....................................
28,196
28,140
28,298
28,145
28,013
28,378
101
Florida ........................................
1,223
1,223
1,222
1,223
1,145
1,159
95
Georgia ......................................
33,356
33,419
33,662
33,734
33,659
33,442
101
South Carolina ............................
5,362
5,210
5,249
5,207
5,053
5,047
92
19 State total ...............................
199,325
200,647
200,269
199,040
199,694
200,363
100
United States..........................
207,163
208,504
208,046
206,843
207,604
208,196
100
Source: USDA National Agricultural Statistics Service Broiler Hatchery, February 26, 2014.
Broiler-Type Chicks Placed States and United States: 2013 and 2014
State
January 18, 2014
January 25, 2014
Week ending
February 1, 2014
February 8, 2014
(1,000 chicks) (1,000 chicks) (1,000 chicks) (1,000 chicks)
February 15, 2014
(1,000 chicks)
February 22, Percent of
2014
previous year
(1,000 chicks)
Alabama .....................................
21,019
20,608
22,085
21,620
21,137
21,175
100
Florida ........................................
1,350
1,439
1,262
1,250
1,317
1,542
129
Georgia ......................................
26,335
27,372
25,896
26,931
25,919
25,206
95
South Carolina ............................
5,134
4,506
4,902
4,157
4,370
4,917
108
19 State total...........................
164,466
162,999
163,385
162,909
163,372
162,568
100
United States.........................
170,256
168,858
169,320
168,506
169,102
168,661
100
Source: USDA National Agricultural Statistics Service Broiler Hatchery, February 26, 2014.
USDA is an equal opportunity provider and employer.
Broiler-Type Eggs Set 19 Selected States and United States: 2014
State
January 18, 2014
January 25, 2014
Week ending
February 1, 2014
February 8, 2014
(1,000 eggs)
(1,000 eggs)
(1,000 eggs)
(1,000 eggs)
Alabama ............................................ Arkansas ............................................ Delaware ............................................ Florida ............................................... Georgia .............................................. Kentucky ............................................. Louisiana ............................................ Maryland ............................................. Mississippi .......................................... Missouri ..............................................
28,196 20,601
4,398 1,223 33,356 7,177 3,864 7,679 17,014 8,431
28,140 20,807
4,484 1,223 33,419 7,859 3,894 7,732 17,331 8,415
28,298 20,487
4,342 1,222 33,662 7,601 3,909 7,690 17,538 8,443
28,145 20,245
4,373 1,223 33,734 7,693 3,894 7,193 17,757 8,176
North Carolina .................................... Oklahoma ........................................... Pennsylvania ...................................... South Carolina .................................. Texas ................................................. Virginia ............................................... California, Tennessee,
and West Virginia ..............................
20,148 6,897 3,796 5,362
14,531 6,405
10,247
20,496 7,161 3,734 5,210
14,609 6,332
9,801
20,055 6,942 4,048 5,249
14,524 6,168
10,091
19,964 7,180 3,730 5,207
14,561 6,110
9,855
19 State total ...................................... Percent of previous year .....................
199,325 102
200,647 102
200,269 101
199,040 101
Other States .......................................
7,838
7,857
7,777
7,803
United States ...................................... Percent of previous year .....................
207,163 102
208,504 102
208,046 101
206,843 101
February 15, 2014
(1,000 eggs)
28,013 20,685
4,382 1,145 33,659 7,636 3,878 7,695 17,543 8,516
20,468 6,915 3,158 5,053
14,598 6,419
9,931
199,694 100
7,910
207,604 100
February 22, 2014
(1,000 eggs)
28,378 20,341
4,480 1,159 33,442 7,566 3,878 7,788 17,567 8,517
20,668 6,452 3,713 5,047
14,803 6,415
10,149
200,363 100
7,833
208,196 100
Broiler-Type Chicks Placed 19 Selected States and United States: 2014
State
January 18, 2014
January 25, 2014
Week ending
February 1, 2014
February 8, 2014
(1,000 chicks) (1,000 chicks) (1,000 chicks) (1,000 chicks)
Alabama ............................................ Arkansas ............................................ Delaware ............................................ Florida ............................................... Georgia .............................................. Kentucky ............................................. Louisiana ............................................ Maryland ............................................. Mississippi .......................................... Missouri ..............................................
21,019 19,213
5,402 1,350 26,335 6,445 3,292 4,805 14,842 5,717
20,608 19,426
4,789 1,439 27,372 6,377 3,364 5,809 14,693 5,785
22,085 19,618
4,713 1,262 25,896 5,914 3,370 5,689 14,971 6,238
21,620 19,856
5,146 1,250 26,931 5,908 3,387 5,691 14,253 6,189
February 15, 2014
(1,000 chicks)
21,137 20,847
4,629 1,317 25,919 6,529 3,406 6,138 14,653 5,175
February 22, 2014
(1,000 chicks)
21,175 18,447
5,324 1,542 25,206 5,633 3,442 5,591 14,709 6,060
North Carolina .................................... Oklahoma ........................................... Pennsylvania ...................................... South Carolina .................................. Texas ................................................. Virginia ............................................... California, Tennessee,
and West Virginia ..............................
16,005 4,922 3,151 5,134
11,388 5,685
9,761
15,827 4,877 3,156 4,506
11,584 5,293
8,094
15,373 4,022 3,149 4,902
11,775 4,783
9,625
16,082 3,514 3,222 4,157
11,631 4,837
9,235
16,223 3,792 3,163 4,370
11,697 5,027
9,350
15,699 4,879 3,328 4,917
11,710 4,671
10,235
19 State total ...................................... Percent of previous year .....................
164,466 101
162,999 100
163,385 100
162,909 100
163,372 100
162,568 100
Other States .......................................
5,790
5,859
5,935
5,597
5,730
6,093
United States ...................................... Percent of previous year .....................
170,256 102
168,858 100
169,320 101
Source: USDA National Agricultural Statistics Service Broiler Hatchery, February 26, 2014.
168,506 100
169,102 100
168,661 100
USDA is an equal opportunity provider and employer.