- Collection:
- Georgia Government Publications
- Serial:
- Broiler hatchery news release / United States Department of Agriculture National Agricultural Statistics Service.
- Title:
- Southern region broiler hatchery news release, 2014 December 31
- Creator:
- Georgia Crop Reporting Service
- Contributor to Resource:
- United States. National Agricultural Statistics Service. Southern Regional Field Office, issuing body.
Alabama. Department of Agriculture and Industries, issuing body.
Florida. Department of Agriculture and Consumer Services, issuing body.
Georgia. Department of Agriculture, issuing body.
South Carolina. Department of Agriculture, issuing body. - Publisher:
- Athens, Ga. : Georgia Agricultural Statistics Service
- Date of Original:
- 2014-12-31
- Subject:
- Poultry--Hatcheries--Georgia--Statistics
Eggs--Production--Georgia--Statistics - Location:
- United States, Georgia, 32.75042, -83.50018
- Medium:
- state government records
- Type:
- Text
- Format:
- application/pdf
- Description:
- Began with: August 28, 2013.
Effective March 12, 2014, name of issuing body appears as Southern Regional Field Office.
August 28, 2013; title from caption (Georgia Government Publications database, viewed January 19, 2018).
January 17, 2018 (received via e-mail on January 18, 2018 from Georgia Department of Agriculture); (Georgia Government Publications database, viewed November 22, 2017). - External Identifiers:
- Call Number GA A400.C7 P1 H2 2014/12-31
- Metadata URL:
- https://dlg.galileo.usg.edu/id:dlg_ggpd_i-ga-ba400-pc7-bp1-bh2-b2014-s12-h31-belec-p-btext
- Digital Object URL:
- https://dlg.galileo.usg.edu/do:dlg_ggpd_i-ga-ba400-pc7-bp1-bh2-b2014-s12-h31-belec-p-btext
- Language:
- eng
- Holding Institution:
- University of Georgia. Map and Government Information Library
- Rights:
-

United States Department of Agriculture National Agricultural Statistics Service
Southern Region News Release Broiler Hatchery
Cooperating with the Alabama Department of Agriculture and Industries, Florida Department of Agriculture and Consumer Services, Georgia Department of Agriculture, and South Carolina Department of Agriculture
Southern Regional Field Office 355 East Hancock Avenue, Suite 320 Athens, GA 30601 (706) 546-2236 www.nass.usda.gov
December 31, 2014
Media Contact: Jim Ewing
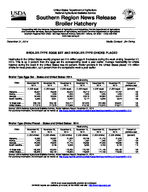
BROILER-TYPE EGGS SET AND BROILER-TYPE CHICKS PLACED
Hatcheries in the United States weekly program set 215 million eggs in incubators during the week ending December 27, 2014. This is up 3 percent from the eggs set the corresponding week a year earlier. Average hatchability for chicks hatched during the week in the United States was 83 percent. Broiler growers in the United States placed 175 million chicks for meat production, up 2 percent from the comparable week a year earlier.
Broiler-Type Eggs Set States and United States: 2014
State
Alabama ............. Florida ................ Georgia .............. South Carolina....
November 22, 2014
(1,000 eggs)
28,637 1,223
34,406 5,665
November 29, 2014
(1,000 eggs)
28,528 1,224
35,094 5,551
December 6, 2014
(1,000 eggs)
28,570 1,223
34,283 5,242
Week ending
December 13, 2014
(1,000 eggs)
28,714 1,223
33,915 5,177
December 20, 2014
(1,000 eggs)
28,214 1,225
34,884 5,928
December 27, 2014
(1,000 eggs)
27,757 1,224
34,472 5,574
Percent of previous year
(percent)
100 100 102 106
19 State total ......
209,106
209,190
204,717
207,020
207,388
206,931
103
United States ......
217,318
217,378
212,968
215,193
215,570
215,017
103
Source: USDA National Agricultural Statistics Service, Broiler Hatchery Report, December 31, 2014. For additional information, the full report can be viewed at http://usda.mannlib.cornell.edu/MannUsda/viewDocumentInfo.do?documentID=1010
Broiler-Type Chicks Placed States and United States: 2014
State
November 22, 2014
November 29, 2014
December 6, 2014
Week ending
December 13, 2014
(1,000 chicks) (1,000 chicks) (1,000 chicks) (1,000 chicks)
Alabama ............. Florida ................ Georgia .............. South Carolina....
19,869 1,232
24,648 4,667
20,887 1,456
25,820 4,746
21,932 1,311
27,178 5,558
22,748 1,487
25,889 5,080
December 20, 2014
(1,000 chicks)
21,776 1,426
27,336 4,736
December 27, 2014
(1,000 chicks)
21,925 1,327
26,889 5,124
Percent of previous year
(percent)
98 104 106 113
19 State total ......
160,338
163,254
170,283
170,732
171,148
168,108
102
United States ......
165,929
169,104
176,605
176,802
177,158
174,506
102
Source: USDA National Agricultural Statistics Service, Broiler Hatchery Report, December 31, 2014. For additional information, the full report can be viewed at http://usda.mannlib.cornell.edu/MannUsda/viewDocumentInfo.do?documentID=1010
USDA is an equal opportunity provider and employer. All NASS reports are available, at no cost, on the NASS web site: http://www.nass.usda.gov
Broiler-Type Eggs Set 19 Selected States and United States: 2014
State
November 22, November 29,
2014
2014
Week ending
December 6, 2014
December 13, 2014
(1,000 eggs)
(1,000 eggs)
(1,000 eggs)
(1,000 eggs)
Alabama ............................................ Arkansas ............................................ Delaware ............................................ Florida ............................................... Georgia .............................................. Kentucky ............................................. Louisiana ............................................ Maryland ............................................. Mississippi .......................................... Missouri ..............................................
28,637 22,339
4,765 1,223 34,406 7,927 3,741 7,893 18,025 8,297
28,528 21,509
4,688 1,224 35,094 6,943 3,726 7,876 18,009 8,299
28,570 22,102
4,778 1,223 34,283 7,877 3,710 7,900 17,395 8,329
28,714 21,961
4,780 1,223 33,915 7,962 3,834 7,929 17,952 8,356
December 20, 2014
(1,000 eggs)
28,214 21,201
4,778 1,225 34,884 7,961 3,622 7,907 17,921 8,321
December 27, 2014
(1,000 eggs)
27,757 21,989
4,734 1,224 34,472 7,942 3,848 7,923 17,828 8,114
North Carolina .................................... Oklahoma ........................................... Pennsylvania ...................................... South Carolina .................................. Texas ................................................. Virginia ............................................... California, Tennessee,
and West Virginia ..............................
21,340 6,608 4,501 5,665
14,962 6,476
12,301
21,250 6,834 4,319 5,551
15,439 6,758
13,143
20,840 6,347 4,601 5,242
14,100 6,120
11,300
21,011 6,682 4,477 5,177
14,420 6,507
12,120
21,105 6,273 4,475 5,928
14,887 6,606
12,080
20,918 6,189 4,415 5,574
15,036 6,455
12,513
19 State total ...................................... Percent of previous year .....................
209,106 104
209,190 103
204,717 102
207,020 102
207,388 103
206,931 103
Other States .......................................
8,212
8,188
8,251
8,173
8,182
8,086
United States ...................................... Percent of previous year .....................
217,318 104
217,378 103
212,968 102
215,193 102
215,570 103
215,017 103
Broiler-Type Chicks Placed 19 Selected States and United States: 2014
State
November 22, November 29,
2014
2014
Week ending
December 6, 2014
December 13, 2014
(1,000 chicks) (1,000 chicks) (1,000 chicks) (1,000 chicks)
Alabama ............................................ Arkansas ............................................ Delaware ............................................ Florida ............................................... Georgia .............................................. Kentucky ............................................. Louisiana ............................................ Maryland ............................................. Mississippi .......................................... Missouri ..............................................
19,869 19,647
5,292 1,232 24,648 6,051 3,116 5,963 13,595 4,974
20,887 18,541
3,806 1,456 25,820 6,426 3,133 6,818 13,974 5,501
21,932 20,756
5,714 1,311 27,178 5,940 3,366 6,174 14,797 5,308
22,748 20,086
5,305 1,487 25,889 6,639 3,339 6,289 14,962 5,629
December 20, 2014
(1,000 chicks)
21,776 19,375
5,357 1,426 27,336 6,146 3,337 5,865 15,052 6,402
December 27, 2014
(1,000 chicks)
21,925 19,483
4,967 1,327 26,889 6,135 3,307 6,417 14,415 5,927
North Carolina .................................... Oklahoma ........................................... Pennsylvania ...................................... South Carolina .................................. Texas ................................................. Virginia ............................................... California, Tennessee,
and West Virginia ..............................
16,258 3,928 3,532 4,667
11,811 5,143
10,612
16,295 4,482 3,914 4,746
11,110 5,650
10,695
15,639 4,216 3,999 5,558
11,889 4,806
11,700
17,142 4,521 3,859 5,080
11,989 5,111
10,657
17,081 4,146 3,891 4,736
12,278 5,345
11,599
16,505 4,980 4,081 5,124
11,329 5,067
10,230
19 State total ...................................... Percent of previous year .....................
160,338 102
163,254 103
170,283 102
170,732 103
171,148 103
168,108 102
Other States .......................................
5,591
5,850
6,322
6,070
6,010
6,398
United States ...................................... Percent of previous year .....................
165,929 102
169,104 103
176,605 103
176,802 103
177,158 103
174,506 102
Source: USDA National Agricultural Statistics Service Broiler Hatchery, December 31, 2014. For additional information, the full report can be viewed at http://usda.mannlib.cornell.edu/MannUsda/viewDocumentInfo.do?documentID=1010
USDA is an equal opportunity provider and employer. All NASS reports are available, at no cost, on the NASS web site: http://www.nass.usda.gov