- Collection:
- Georgia Government Publications
- Serial:
- Broiler hatchery news release / United States Department of Agriculture National Agricultural Statistics Service.
- Title:
- Georgia broiler hatchery news release, 2013 August 7
- Creator:
- Georgia Crop Reporting Service
- Contributor to Resource:
- United States. National Agricultural Statistics Service. Southern Regional Field Office, issuing body.
Alabama. Department of Agriculture and Industries, issuing body.
Florida. Department of Agriculture and Consumer Services, issuing body.
Georgia. Department of Agriculture, issuing body.
South Carolina. Department of Agriculture, issuing body. - Publisher:
- Athens, Ga. : Georgia Agricultural Statistics Service
- Date of Original:
- 2013-08-07
- Subject:
- Poultry--Hatcheries--Georgia--Statistics
Eggs--Production--Georgia--Statistics - Location:
- United States, Georgia, 32.75042, -83.50018
- Medium:
- state government records
- Type:
- Text
- Format:
- application/pdf
- Description:
- Began with: August 28, 2013.
Effective March 12, 2014, name of issuing body appears as Southern Regional Field Office.
August 28, 2013; title from caption (Georgia Government Publications database, viewed January 19, 2018).
January 17, 2018 (received via e-mail on January 18, 2018 from Georgia Department of Agriculture); (Georgia Government Publications database, viewed November 22, 2017). - External Identifiers:
- Call Number GA A400.C7 P1 H2 2013/8-7
- Metadata URL:
- https://dlg.galileo.usg.edu/id:dlg_ggpd_i-ga-ba400-pc7-bp1-bh2-b2013-s8-h7-belec-p-btext
- Digital Object URL:
- https://dlg.galileo.usg.edu/do:dlg_ggpd_i-ga-ba400-pc7-bp1-bh2-b2013-s8-h7-belec-p-btext
- Language:
- eng
- Holding Institution:
- University of Georgia. Map and Government Information Library
- Rights:
-

United States Department of Agriculture National Agricultural Statistics Service
GA Broiler Hatchery News Release
In Cooperation with the Georgia Department of Agriculture Georgia Field Office 355 East Hancock Avenue, Suite 320 Athens, GA 30601 (706) 546-2236
www.nass.usda.gov
August 7, 2013
Media Contact: Douglas G. Kleweno nassrfosor@nass.usda.gov
BROILERS PLACED IN GEORGIA DOWN 1 PERCENT BROILER EGGS SET UP 6 PERCENT
Placement of broiler chicks in Georgia during the week ending August 3, 2013 was 27.9 million, up 1 percent from the previous week, but down 1 percent from the comparable week last year, according to the USDA, NASS Georgia Field Office. An estimated 33.7 million broiler type eggs were set by Georgia hatcheries, up 1 percent from the previous week, and up 6 percent from the comparable week a year earlier.
Georgia Broiler-Type Eggs Set and Broiler-Type Chicks Placed
Week Ended
Jun 29 Jul 6 Jul 13 Jul 20 Jul 27 Aug 3
Eggs Set
2012
2013
Thous ands
31,470
33,691
32,496
33,551
32,461
33,766
31,849
34,162
31,573
33,353
31,739
33,671
% of prev. yr.
107 103 104 107 106 106
Chicks Placed
2012
2013
Thous ands
27,318
26,199
26,697
26,355
27,173
27,607
26,688
26,274
28,385
27,585
28,157
27,853
% of prev. yr.
96 99 102 98 97 99
Million Chicks
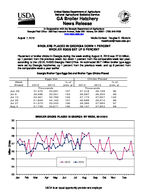
BROILER CHICKS PLACED IN GEORGIA BY WEEK, 2012-2013 30
29
28
27
26
25
2012
2013
24
23 Jan Feb Mar
Apr May Jun
Jul Aug
Sep Oct Nov
Dec
USDA is an equal opportunity provider and employer.
Broiler-Type Eggs Set 19 Selected States and United States: 2013
State
June 29, 2013
July 6, 2013
Week ending
July 13, 2013
July 20, 2013
(1,000 eggs)
(1,000 eggs)
(1,000 eggs)
(1,000 eggs)
Alabama ............................................. Arkansas ............................................ Delaware ............................................ Florida ................................................ Georgia .............................................. Kentucky ............................................. Louisiana ............................................ Maryland ............................................. Mississippi .......................................... Missouri ..............................................
28,317 21,335
3,690 1,222 33,691 7,741 3,546 7,659 17,620 8,261
28,160 21,784
3,688 1,222 33,551 8,028 3,486 7,497 17,876 8,226
28,324 21,859
3,690 1,225 33,766 8,009 3,485 7,558 17,905 7,901
28,408 21,223
3,692 1,223 34,162 7,887 3,485 7,606 16,863 8,357
North Carolina .................................... Oklahoma ........................................... Pennsylvania ...................................... South Carolina .................................... Texas ................................................. Virginia ............................................... California, Tennessee,
and West Virginia ..............................
20,114 6,887 4,126 5,607
14,350 6,558
10,116
20,424 6,836 4,022 5,381
14,954 6,558
10,828
20,044 6,698 4,010 5,267
15,060 6,529
11,378
19,598 6,880 4,017 5,274
14,734 6,396
10,183
19 State total ...................................... Percent of previous year .....................
200,840 103
202,521 105
202,708 103
199,988 103
Other States .......................................
8,032
7,901
7,762
7,909
United States ......................................
208,872
210,422
210,470
207,897
July 27, 2013
(1,000 eggs)
28,114 21,643
3,691 1,225 33,353 7,996 3,485 7,631 17,770 8,201
20,444 6,828 3,934 5,110
14,916 6,391
10,492
201,224 103
7,861
209,085
August 3, 2013
(1,000 eggs)
28,059 20,787
3,692 1,222 33,671 8,060 3,485 7,492 16,982 8,228
20,466 6,824 4,078 5,152
14,671 6,320
10,700
199,889 103
7,824
207,713
Broiler-Type Chicks Placed 19 Selected States and United States: 2013
State
June 29, 2013
July 6, 2013
Week ending
July 13, 2013
July 20, 2013
(1,000 chicks) (1,000 chicks) (1,000 chicks) (1,000 chicks)
Alabama ............................................. Arkansas ............................................ Delaware ............................................ Florida ................................................ Georgia .............................................. Kentucky ............................................. Louisiana ............................................ Maryland ............................................. Mississippi .......................................... Missouri ..............................................
21,902 21,568
4,081 1,333 26,199 6,054 3,123 6,435 15,350 5,209
21,391 20,458
4,694 1,439 26,355 6,084 3,035 5,805 14,610 5,216
21,621 19,637
4,722 1,303 27,607 6,471 3,169 6,068 15,186 5,433
22,343 20,104
4,239 1,212 26,274 6,036 3,178 6,902 14,703 5,412
July 27, 2013
(1,000 chicks)
21,302 19,843
4,708 1,385 27,585 5,993 3,088 5,296 15,225 5,870
August 3, 2013
(1,000 chicks)
21,354 21,006
4,304 1,259 27,853 5,975 3,142 6,020 15,224 5,113
North Carolina .................................... Oklahoma ........................................... Pennsylvania ...................................... South Carolina .................................... Texas ................................................. Virginia ............................................... California, Tennessee,
and West Virginia ..............................
16,648 4,097 3,151 5,399
11,824 5,435
10,356
16,492 5,525 3,108 4,775
12,295 5,287
11,292
16,053 4,692 3,063 4,430
12,422 5,162
10,088
15,856 4,716 3,099 4,916
11,951 4,647
10,123
16,024 4,569 2,949 4,570
12,775 5,848
10,107
15,651 4,023 3,162 4,423
12,604 5,235
11,017
19 State total ...................................... Percent of previous year .....................
168,164 101
167,861 102
167,127 102
165,711 101
167,137 104
167,365 102
Other States .......................................
5,873
5,910
5,787
5,995
6,171
5,696
United States ......................................
174,037
173,771
172,914
171,706
173,308
173,061
Average hatchability for chicks hatched in the 19 selected States during the week was 85 percent. Average hatchability is calculated by dividing chicks hatched during the week by eggs set three weeks earlier.