- Collection:
- Georgia Government Publications
- Serial:
- Broiler hatchery news release / United States Department of Agriculture National Agricultural Statistics Service.
- Title:
- Georgia broiler hatchery news release, 2013 August 14
- Creator:
- Georgia Crop Reporting Service
- Contributor to Resource:
- United States. National Agricultural Statistics Service. Southern Regional Field Office, issuing body.
Alabama. Department of Agriculture and Industries, issuing body.
Florida. Department of Agriculture and Consumer Services, issuing body.
Georgia. Department of Agriculture, issuing body.
South Carolina. Department of Agriculture, issuing body. - Publisher:
- Athens, Ga. : Georgia Agricultural Statistics Service
- Date of Original:
- 2013-08-14
- Subject:
- Poultry--Hatcheries--Georgia--Statistics
Eggs--Production--Georgia--Statistics - Location:
- United States, Georgia, 32.75042, -83.50018
- Medium:
- state government records
- Type:
- Text
- Format:
- application/pdf
- Description:
- Began with: August 28, 2013.
Effective March 12, 2014, name of issuing body appears as Southern Regional Field Office.
August 28, 2013; title from caption (Georgia Government Publications database, viewed January 19, 2018).
January 17, 2018 (received via e-mail on January 18, 2018 from Georgia Department of Agriculture); (Georgia Government Publications database, viewed November 22, 2017). - External Identifiers:
- Call Number GA A400.C7 P1 H2 2013/8-14
- Metadata URL:
- https://dlg.galileo.usg.edu/id:dlg_ggpd_i-ga-ba400-pc7-bp1-bh2-b2013-s8-h14-belec-p-btext
- Digital Object URL:
- https://dlg.galileo.usg.edu/do:dlg_ggpd_i-ga-ba400-pc7-bp1-bh2-b2013-s8-h14-belec-p-btext
- Language:
- eng
- Holding Institution:
- University of Georgia. Map and Government Information Library
- Rights:
-

United States Department of Agriculture National Agricultural Statistics Service
GA Broiler Hatchery News Release
In Cooperation with the Georgia Department of Agriculture Georgia Field Office 355 East Hancock Avenue, Suite 320 Athens, GA 30601 (706) 546-2236
www.nass.usda.gov
August 14, 2013
Media Contact: Douglas G. Kleweno nassrfosor@nass.usda.gov
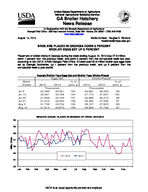
BROILERS PLACED IN GEORGIA DOWN 3 PERCENT BROILER EGGS SET UP 6 PERCENT
Placement of broiler chicks in Georgia during the week ending August 10, 2013 was 27.8 million, down 1 percent from the previous week, and down 3 percent from the comparable week last year, according to the USDA, NASS Georgia Field Office. An estimated 33.9 million broiler type eggs were set by Georgia hatcheries, up 1 percent from the previous week, and up 6 percent from the comparable week a year earlier.
Week Ended
Jul 6 Jul 13 Jul 20 Jul 27 Aug 3 Aug 10
Georgia Broiler-Type Eggs Set and Broiler-Type Chicks Placed
Eggs Set
Chicks Placed
% of
2012
2013
prev. yr. 2012
2013
Thous ands
Thous ands
32,496
33,551
103
26,697
26,355
32,461
33,766
104
27,173
27,607
31,849
34,162
107
26,688
26,274
31,573
33,353
106
28,385
27,585
31,739
33,704
106
28,157
27,933
31,814
33,873
106
28,569
27,766
% of prev. yr.
99 102
98 97 99 97
BROILER CHICKS PLACED IN GEORGIA BY WEEK, 2012-2013 30
29
28
27
26
25
2012
2013
24
23 Jan Feb Mar
Apr May Jun
Jul
Aug
Sep Oct Nov
Dec
Million Chicks
USDA is an equal opportunity provider and employer.
Broiler-Type Eggs Set 19 Selected States and United States: 2013
State
July 6, 2013
July 13, 2013
Week ending
July 20, 2013
July 27, 2013
(1,000 eggs)
(1,000 eggs)
(1,000 eggs)
(1,000 eggs)
Alabama ............................................. Arkansas ............................................ Delaware ............................................ Florida ................................................ Georgia .............................................. Kentucky ............................................. Louisiana ............................................ Maryland ............................................. Mississippi .......................................... Missouri ..............................................
28,160 21,784
3,688 1,222 33,551 8,028 3,486 7,497 17,876 8,226
28,324 21,859
3,690 1,225 33,766 8,075 3,485 7,558 17,905 7,901
28,435 21,223
3,692 1,223 34,162 7,897 3,485 7,606 17,088 8,357
28,114 21,643
3,691 1,225 33,353 7,996 3,485 7,631 17,770 8,201
North Carolina .................................... Oklahoma ........................................... Pennsylvania ...................................... South Carolina .................................... Texas ................................................. Virginia ............................................... California, Tennessee,
and West Virginia ..............................
20,424 6,836 4,022 5,381
14,954 6,558
10,809
20,044 6,698 4,010 5,267
15,060 6,529
11,341
19,685 6,914 3,979 5,274
14,734 6,396
10,169
20,444 6,828 3,878 5,110
14,916 6,391
10,496
19 State total ...................................... Percent of previous year .....................
202,502 105
202,737 103
200,319 103
201,172 103
Other States .......................................
7,946
7,779
7,897
7,862
United States ......................................
210,448
210,516
208,216
209,034
August 3, 2013
(1,000 eggs)
28,059 20,787
3,692 1,222 33,704 8,069 3,485 7,492 16,982 8,228
20,466 6,824 4,024 5,152
14,671 6,320
10,571
199,748 102
7,824
207,572
August 10, 2013
(1,000 eggs)
28,438 21,338
3,692 1,224 33,873 7,974 3,727 7,678 17,361 8,417
20,236 6,815 4,224 5,362
14,731 6,352
10,618
202,060 105
7,901
209,961
Broiler-Type Chicks Placed 19 Selected States and United States: 2013
State
July 6, 2013
July 13, 2013
Week ending
July 20, 2013
July 27, 2013
(1,000 chicks) (1,000 chicks) (1,000 chicks) (1,000 chicks)
Alabama ............................................. Arkansas ............................................ Delaware ............................................ Florida ................................................ Georgia .............................................. Kentucky ............................................. Louisiana ............................................ Maryland ............................................. Mississippi .......................................... Missouri ..............................................
21,391 20,458
4,694 1,439 26,355 6,084 3,035 5,805 14,610 5,216
21,621 19,637
4,722 1,303 27,607 6,471 3,169 6,068 15,186 5,433
22,343 20,104
4,240 1,212 26,274 6,036 3,178 6,903 14,703 5,412
21,302 19,843
4,708 1,385 27,585 5,693 3,088 5,298 15,225 5,870
August 3, 2013
(1,000 chicks)
21,354 21,006
4,261 1,259 27,933 6,324 3,142 6,177 15,224 5,113
August 10, 2013
(1,000 chicks)
21,678 19,148
4,785 1,352 27,766 6,053 3,117 6,268 14,417 6,239
North Carolina .................................... Oklahoma ........................................... Pennsylvania ...................................... South Carolina .................................... Texas ................................................. Virginia ............................................... California, Tennessee,
and West Virginia ..............................
16,492 5,525 3,108 4,775
12,295 5,287
11,292
16,053 4,692 3,063 4,430
12,422 5,162
10,088
15,856 4,716 2,958 4,916
11,951 4,647
10,123
16,024 4,569 2,809 4,570
12,775 5,848
10,739
15,651 4,023 3,063 4,423
12,604 5,235
11,248
15,439 4,662 3,060 4,496
12,402 4,752
10,011
19 State total ...................................... Percent of previous year .....................
167,861 102
167,127 102
165,572 101
167,331 104
168,040 103
165,645 102
Other States .......................................
5,905
5,798
5,989
6,205
5,722
5,843
United States ......................................
173,766
172,925
171,561
173,536
173,762
171,488
Average hatchability for chicks hatched in the 19 selected States during the week was 85 percent. Average hatchability is calculated by dividing chicks hatched during the week by eggs set three weeks earlier.