- Collection:
- Georgia Government Publications
- Serial:
- Broiler hatchery news release / United States Department of Agriculture National Agricultural Statistics Service.
- Title:
- Georgia broiler hatchery news release, 2013 May 1
- Creator:
- Georgia Crop Reporting Service
- Contributor to Resource:
- United States. National Agricultural Statistics Service. Southern Regional Field Office, issuing body.
Alabama. Department of Agriculture and Industries, issuing body.
Florida. Department of Agriculture and Consumer Services, issuing body.
Georgia. Department of Agriculture, issuing body.
South Carolina. Department of Agriculture, issuing body. - Publisher:
- Athens, Ga. : Georgia Agricultural Statistics Service
- Date of Original:
- 2013-05-01
- Subject:
- Poultry--Hatcheries--Georgia--Statistics
Eggs--Production--Georgia--Statistics - Location:
- United States, Georgia, 32.75042, -83.50018
- Medium:
- state government records
- Type:
- Text
- Format:
- application/pdf
- Description:
- Began with: August 28, 2013.
Effective March 12, 2014, name of issuing body appears as Southern Regional Field Office.
August 28, 2013; title from caption (Georgia Government Publications database, viewed January 19, 2018).
January 17, 2018 (received via e-mail on January 18, 2018 from Georgia Department of Agriculture); (Georgia Government Publications database, viewed November 22, 2017). - External Identifiers:
- Call Number GA A400.C7 P1 H2 2013/5-1
- Metadata URL:
- https://dlg.galileo.usg.edu/id:dlg_ggpd_i-ga-ba400-pc7-bp1-bh2-b2013-s5-h1-belec-p-btext
- Digital Object URL:
- https://dlg.galileo.usg.edu/do:dlg_ggpd_i-ga-ba400-pc7-bp1-bh2-b2013-s5-h1-belec-p-btext
- Language:
- eng
- Holding Institution:
- University of Georgia. Map and Government Information Library
- Rights:
-

United States Department of Agriculture National Agricultural Statistics Service
GA Broiler Hatchery News Release
In Cooperation with the Georgia Department of Agriculture Georgia Field Office 355 East Hancock Avenue, Suite 320 Athens, GA 30601 (706) 546-2236
www.nass.usda.gov
May 1, 2013
Media Contact: Douglas G. Kleweno nass-ga@nass.usda.gov
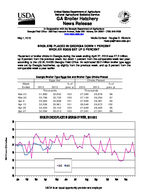
BROILERS PLACED IN GEORGIA DOWN 1 PERCENT BROILER EGGS SET UP 3 PERCENT
Placement of broiler chicks in Georgia during the week ending April 27, 2013 was 27.2 million, up 3 percent from the previous week, but down 1 percent from the comparable week last year, according to the USDA, NASS Georgia Field Office. An estimated 33.2 million broiler type eggs were set by Georgia hatcheries, up slightly from the previous week, and up 3 percent from the comparable week a year earlier.
Week Ended
Mar 23 Mar 30 Apr 6 Apr 13 Apr 20 Apr 27
30
Georgia Broiler-Type Eggs Set and Broiler-Type Chicks Placed
Eggs Set
Chicks Placed
% of
% of
2012
2013
prev. yr. 2012
2013
prev. yr.
Thous ands
Thous ands
31,890 32,852 103
27,380 26,878
98
32,796 32,702 100
27,150 26,254
97
32,564 32,908 101
27,999 26,381
94
32,536 32,961 101
26,046 26,672 102
32,220 33,132 103
27,689 26,420
95
32,356 33,213 103
27,391 27,241
99
BROILER CHICKS PLACED IN GEORGIA BY WEEK, 2012-2013
29
28
27
26
25 2012 2013
24
23 Jan Feb Mar Apr
May Jun Jul
Aug Sep
Oct Nov Dec
Million Chicks
USDA is an equal opportunity provider and employer.
Broiler-Type Eggs Set 19 Selected States and United States: 2013
State
March 23, 2013
March 30, 2013
Week ending
April 6, 2013
April 13, 2013
(1,000 eggs)
(1,000 eggs)
(1,000 eggs)
(1,000 eggs)
Alabama ............................................. Arkansas ............................................ Delaware ............................................ Florida ................................................ Georgia .............................................. Kentucky ............................................. Louisiana ............................................ Maryland ............................................. Mississippi .......................................... Missouri ..............................................
27,971 21,080
3,323 1,220 32,852 7,660 3,455 7,399 17,593 8,126
28,383 21,504
3,413 1,221 32,702 7,916 3,531 7,625 17,741 8,027
28,134 21,714
3,411 1,225 32,908 7,648 3,500 7,407 17,906 7,686
28,392 21,809
3,412 1,175 32,961 7,707 3,546 7,582 17,603 8,341
North Carolina .................................... Oklahoma ........................................... Pennsylvania ...................................... South Carolina .................................... Texas ................................................. Virginia ............................................... California, Tennessee,
and West Virginia ..............................
19,942 6,619 3,890 5,346
15,162 6,518
11,273
20,350 6,538 3,718 5,373
14,651 6,591
11,023
19,965 6,755 4,009 5,365
14,535 6,622
10,956
19,878 6,564 3,883 5,401
14,417 6,636
10,738
19 State total ...................................... Percent of previous year .....................
199,429 102
200,307 101
199,746 100
200,045 100
Other States .......................................
8,133
8,030
7,873
8,134
United States ......................................
207,562
208,337
207,619
208,179
April 20, 2013
(1,000 eggs)
27,912 21,109
3,540 1,221 33,132 7,747 3,546 7,598 17,814 8,313
19,797 6,354 3,876 5,203
14,767 6,562
10,759
199,250 100
8,039
207,289
April 27, 2013
(1,000 eggs)
27,314 20,913
3,411 1,221 33,213 7,610 3,470 7,580 17,823 8,018
19,963 6,589 3,903 5,420
14,851 6,568
10,156
198,023 100
8,067
206,090
Broiler-Type Chicks Placed 19 Selected States and United States: 2013
State
March 23, 2013
March 30, 2013
Week ending
April 6, 2013
April 13, 2013
(1,000 chicks) (1,000 chicks) (1,000 chicks) (1,000 chicks)
Alabama ............................................. Arkansas ............................................ Delaware ............................................ Florida ................................................ Georgia .............................................. Kentucky ............................................. Louisiana ............................................ Maryland ............................................. Mississippi .......................................... Missouri ..............................................
21,182 20,406
4,602 1,141 26,878 6,691 2,994 5,503 14,896 5,769
20,553 21,409
3,808 1,291 26,254 5,585 3,288 6,642 14,374 5,560
21,761 20,019
4,213 1,224 26,381 6,333 3,056 5,548 15,113 5,418
20,898 19,104
3,528 1,328 26,672 5,891 3,116 6,852 14,917 5,954
April 20, 2013
(1,000 chicks)
21,280 19,573
3,652 1,443 26,420 6,589 3,175 5,981 15,069 6,183
April 27, 2013
(1,000 chicks)
20,609 19,698
3,628 1,336 27,241 6,027 3,149 6,523 15,092 5,296
North Carolina .................................... Oklahoma ........................................... Pennsylvania ...................................... South Carolina .................................... Texas ................................................. Virginia ............................................... California, Tennessee,
and West Virginia ..............................
16,298 4,171 2,947 3,898
12,471 4,856
9,854
15,778 3,390 3,118 4,811
12,133 5,052
11,250
15,739 4,005 2,990 4,644
12,612 5,851
10,178
15,062 4,439 3,092 4,744
12,676 4,896
10,519
15,815 4,260 2,952 4,292
12,050 5,632
10,246
15,673 4,845 3,272 5,087
11,874 5,178
10,836
19 State total ...................................... Percent of previous year .....................
164,557 100
164,296 99
165,085 100
163,688 100
164,612 99
165,364 99
Other States .......................................
5,767
5,690
5,837
6,329
6,077
5,659
United States ......................................
170,324
169,986
170,922
170,017
170,689
171,023
Average hatchability for chicks hatched in the 19 selected States during the week was 85 percent. Average hatchability is calculated by dividing chicks hatched during the week by eggs set three weeks earlier.