- Collection:
- Georgia Government Publications
- Serial:
- Broiler hatchery news release / United States Department of Agriculture National Agricultural Statistics Service.
- Title:
- Georgia broiler hatchery news release, 2013 April 3
- Creator:
- Georgia Crop Reporting Service
- Contributor to Resource:
- United States. National Agricultural Statistics Service. Southern Regional Field Office, issuing body.
Alabama. Department of Agriculture and Industries, issuing body.
Florida. Department of Agriculture and Consumer Services, issuing body.
Georgia. Department of Agriculture, issuing body.
South Carolina. Department of Agriculture, issuing body. - Publisher:
- Athens, Ga. : Georgia Agricultural Statistics Service
- Date of Original:
- 2013-04-03
- Subject:
- Poultry--Hatcheries--Georgia--Statistics
Eggs--Production--Georgia--Statistics - Location:
- United States, Georgia, 32.75042, -83.50018
- Medium:
- state government records
- Type:
- Text
- Format:
- application/pdf
- Description:
- Began with: August 28, 2013.
Effective March 12, 2014, name of issuing body appears as Southern Regional Field Office.
August 28, 2013; title from caption (Georgia Government Publications database, viewed January 19, 2018).
January 17, 2018 (received via e-mail on January 18, 2018 from Georgia Department of Agriculture); (Georgia Government Publications database, viewed November 22, 2017). - External Identifiers:
- Call Number GA A400.C7 P1 H2 2013/4-3
- Metadata URL:
- https://dlg.galileo.usg.edu/id:dlg_ggpd_i-ga-ba400-pc7-bp1-bh2-b2013-s4-h3-belec-p-btext
- Digital Object URL:
- https://dlg.galileo.usg.edu/do:dlg_ggpd_i-ga-ba400-pc7-bp1-bh2-b2013-s4-h3-belec-p-btext
- Language:
- eng
- Holding Institution:
- University of Georgia. Map and Government Information Library
- Rights:
-

United States Department of Agriculture National Agricultural Statistics Service
GA Broiler Hatchery News Release
In Cooperation with the Georgia Department of Agriculture Georgia Field Office 355 East Hancock Avenue, Suite 320 Athens, GA 30601 (706) 546-2236
www.nass.usda.gov
April 3, 2013
Media Contact: Douglas G. Kleweno nass-ga@nass.usda.gov
BROILERS PLACED IN GEORGIA DOWN 3 PERCENT BROILER EGGS SET DOWN SLIGHTY
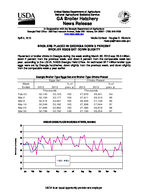
Placement of broiler chicks in Georgia during the week ending March 30, 2013 was 26.3 million, down 2 percent from the previous week, and down 3 percent from the comparable week last year, according to the USDA, NASS Georgia Field Office. An estimated 32.7 million broiler type eggs were set by Georgia hatcheries, down slightly from the previous week, and down slightly from the comparable week a year earlier.
Week Ended
Feb 23 Mar 2 Mar 9 Mar 16 Mar 23 Mar 30
Georgia Broiler-Type Eggs Set and Broiler-Type Chicks Placed
Eggs Set
Chicks Placed
% of
% of
2012
2013
prev. yr. 2012
2013
prev. yr.
Thous ands
Thous ands
32,143 33,125 103
27,970 26,431
94
32,150 33,177 103
27,611 26,310
95
32,374 33,057 102
28,429 27,148
95
32,249 33,182 103
27,958 27,044
97
31,890 32,852 103
27,380 26,878
98
32,796 32,702 100
27,150 26,254
97
BROILER CHICKS PLACED IN GEORGIA BY WEEK, 2012-2013
30
29
28
27
26
25 2012 2013
24
23 Jan Feb Mar Apr
May Jun Jul
Aug Sep
Oct Nov Dec
Million Chicks
USDA is an equal opportunity provider and employer.
Broiler-Type Eggs Set 19 Selected States and United States: 2013
State
February 23, 2013
March 2, 2013
Week ending
March 9, 2013
March 16, 2013
(1,000 eggs)
(1,000 eggs)
(1,000 eggs)
(1,000 eggs)
Alabama ............................................. Arkansas ............................................ Delaware ............................................ Florida ................................................ Georgia .............................................. Kentucky ............................................. Louisiana ............................................ Maryland ............................................. Mississippi .......................................... Missouri ..............................................
28,227 21,840
3,419 1,223 33,125 7,620 3,349 7,213 17,606 8,105
27,971 21,816
3,415 1,221 33,177 7,773 3,364 7,254 17,516 8,110
27,539 21,772
3,409 1,221 33,057 7,778 3,379 7,453 16,957 8,268
28,113 21,156
3,412 1,221 33,182 7,708 3,395 7,457 17,869 7,938
North Carolina .................................... Oklahoma ........................................... Pennsylvania ...................................... South Carolina .................................... Texas ................................................. Virginia ............................................... California, Tennessee,
and West Virginia ..............................
20,316 6,837 3,861 5,492
15,038 6,188
10,187
20,312 6,918 3,760 5,417
15,172 6,396
10,415
20,085 6,478 3,949 5,333
15,223 6,678
10,617
19,926 6,909 3,796 5,275
15,238 6,653
10,906
19 State total ...................................... Percent of previous year .....................
199,646 102
200,007 101
199,196 100
200,154 101
Other States .......................................
7,932
7,923
7,989
8,001
United States ......................................
207,578
207,930
207,185
208,155
March 23, 2013
(1,000 eggs)
28,131 21,080
3,323 1,220 32,852 7,470 3,455 7,399 17,593 8,126
19,795 6,969 3,844 5,346
15,159 6,518
11,333
199,613 102
8,230
207,843
March 30, 2013
(1,000 eggs)
28,150 21,718
3,411 1,221 32,702 7,746 3,531 7,625 17,741 8,027
20,350 6,393 3,780 5,373
14,648 6,591
10,604
199,611 101
7,981
207,592
Broiler-Type Chicks Placed 19 Selected States and United States: 2013
State
February 23, 2013
March 2, 2013
Week ending
March 9, 2013
March 16, 2013
(1,000 chicks) (1,000 chicks) (1,000 chicks) (1,000 chicks)
Alabama ............................................. Arkansas ............................................ Delaware ............................................ Florida ................................................ Georgia .............................................. Kentucky ............................................. Louisiana ............................................ Maryland ............................................. Mississippi .......................................... Missouri ..............................................
21,257 20,166
4,202 1,194 26,431 5,902 2,964 5,684 14,629 5,630
20,731 20,311
3,818 1,089 26,310 5,731 2,967 6,713 14,814 5,172
20,548 20,875
4,419 1,488 27,148 6,481 2,968 6,163 14,731 5,144
21,217 20,533
3,583 1,224 27,044 6,240 3,020 6,281 14,961 5,502
March 23, 2013
(1,000 chicks)
21,182 20,406
4,602 1,141 26,878 6,691 2,994 5,503 14,896 5,769
March 30, 2013
(1,000 chicks)
20,553 21,409
4,131 1,291 26,254 5,604 3,288 6,334 14,374 5,560
North Carolina .................................... Oklahoma ........................................... Pennsylvania ...................................... South Carolina .................................... Texas ................................................. Virginia ............................................... California, Tennessee,
and West Virginia ..............................
15,911 4,400 2,850 4,572
12,329 5,454
9,611
15,780 4,996 2,977 4,436
12,435 5,024
9,259
16,412 4,797 3,031 4,442
12,202 4,451
9,508
16,208 4,364 3,062 3,894
12,433 5,087
10,121
16,298 4,171 2,988 3,898
12,479 4,856
9,942
15,778 3,390 3,180 4,811
12,141 4,454
11,254
19 State total ...................................... Percent of previous year .....................
163,186 102
162,563 100
164,808 101
164,774 101
164,694 100
163,806 99
Other States .......................................
5,939
5,925
5,866
5,508
5,767
5,690
United States ......................................
169,125
168,488
170,674
170,282
170,461
169,496
Average hatchability for chicks hatched in the 19 selected States during the week was 85 percent. Average hatchability is calculated by dividing chicks hatched during the week by eggs set three weeks earlier.