- Collection:
- Georgia Government Publications
- Serial:
- Broiler hatchery news release / United States Department of Agriculture National Agricultural Statistics Service.
- Title:
- Georgia broiler hatchery news release, 2014 April 17
- Creator:
- Georgia Crop Reporting Service
- Contributor to Resource:
- United States. National Agricultural Statistics Service. Southern Regional Field Office, issuing body.
Alabama. Department of Agriculture and Industries, issuing body.
Florida. Department of Agriculture and Consumer Services, issuing body.
Georgia. Department of Agriculture, issuing body.
South Carolina. Department of Agriculture, issuing body. - Publisher:
- Athens, Ga. : Georgia Agricultural Statistics Service
- Date of Original:
- 2013-04-17
- Subject:
- Poultry--Hatcheries--Georgia--Statistics
Eggs--Production--Georgia--Statistics - Location:
- United States, Georgia, 32.75042, -83.50018
- Medium:
- state government records
- Type:
- Text
- Format:
- application/pdf
- Description:
- Began with: August 28, 2013.
Effective March 12, 2014, name of issuing body appears as Southern Regional Field Office.
August 28, 2013; title from caption (Georgia Government Publications database, viewed January 19, 2018).
January 17, 2018 (received via e-mail on January 18, 2018 from Georgia Department of Agriculture); (Georgia Government Publications database, viewed November 22, 2017). - External Identifiers:
- Call Number GA A400.C7 P1 H2 2013/4-17
- Metadata URL:
- https://dlg.galileo.usg.edu/id:dlg_ggpd_i-ga-ba400-pc7-bp1-bh2-b2013-s4-h17-belec-p-btext
- Digital Object URL:
- https://dlg.galileo.usg.edu/do:dlg_ggpd_i-ga-ba400-pc7-bp1-bh2-b2013-s4-h17-belec-p-btext
- Language:
- eng
- Holding Institution:
- University of Georgia. Map and Government Information Library
- Rights:
-

United States Department of Agriculture National Agricultural Statistics Service
GA Broiler Hatchery News Release
In Cooperation with the Georgia Department of Agriculture Georgia Field Office 355 East Hancock Avenue, Suite 320 Athens, GA 30601 (706) 546-2236
www.nass.usda.gov
April 17, 2013
Media Contact: Douglas G. Kleweno nass-ga@nass.usda.gov
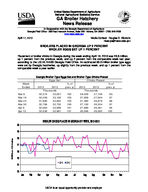
BROILERS PLACED IN GEORGIA UP 2 PERCENT BROILER EGGS SET UP 1 PERCENT
Placement of broiler chicks in Georgia during the week ending April 13, 2013 was 26.6 million, up 1 percent from the previous week, and up 2 percent from the comparable week last year, according to the USDA, NASS Georgia Field Office. An estimated 33.0 million broiler type eggs were set by Georgia hatcheries, up slightly from the previous week, and up 1 percent from the comparable week a year earlier.
Week Ended
Mar 9 Mar 16 Mar 23 Mar 30 Apr 6 Apr 13
Georgia Broiler-Type Eggs Set and Broiler-Type Chicks Placed
Eggs Set
Chicks Placed
% of
% of
2012
2013
prev. yr. 2012
2013
prev. yr.
Thous ands
Thous ands
32,374 33,057 102
28,429 27,148
95
32,249 33,182 103
27,958 27,044
97
31,890 32,852 103
27,380 26,878
98
32,796 32,702 100
27,150 26,254
97
32,564 32,908 101
27,999 26,381
94
32,536 32,961 101
26,046 26,592 102
BROILER CHICKS PLACED IN GEORGIA BY WEEK, 2012-2013
30
29
28
27
26
25 2012 2013
24
23 Jan Feb Mar Apr
May Jun Jul
Aug Sep
Oct Nov Dec
Million Chicks
USDA is an equal opportunity provider and employer.
Broiler-Type Eggs Set 19 Selected States and United States: 2013
State
March 9, 2013
March 16, 2013
Week ending
March 23, 2013
March 30, 2013
(1,000 eggs)
(1,000 eggs)
(1,000 eggs)
(1,000 eggs)
Alabama ............................................. Arkansas ............................................ Delaware ............................................ Florida ................................................ Georgia .............................................. Kentucky ............................................. Louisiana ............................................ Maryland ............................................. Mississippi .......................................... Missouri ..............................................
27,539 21,772
3,409 1,221 33,057 7,778 3,379 7,453 16,957 8,268
28,212 21,156
3,412 1,221 33,182 7,831 3,395 7,457 17,869 7,938
27,971 21,080
3,323 1,220 32,852 7,470 3,455 7,399 17,593 8,126
28,369 21,718
3,413 1,221 32,702 7,780 3,531 7,625 17,741 8,027
North Carolina .................................... Oklahoma ........................................... Pennsylvania ...................................... South Carolina .................................... Texas ................................................. Virginia ............................................... California, Tennessee,
and West Virginia ..............................
20,085 6,478 3,983 5,333
15,213 6,678
10,585
19,926 6,471 3,772 5,275
15,241 6,653
10,726
19,942 6,619 3,890 5,346
15,162 6,518
11,273
20,350 6,393 3,718 5,373
14,651 6,591
11,023
19 State total ...................................... Percent of previous year .....................
199,188 100
199,737 101
199,239 101
200,226 101
Other States .......................................
7,989
8,001
8,133
8,040
United States ......................................
207,177
207,738
207,372
208,266
April 6, 2013
(1,000 eggs)
28,140 21,500
3,411 1,225 32,908 7,643 3,500 7,407 17,906 7,686
20,022 6,653 4,009 5,365
14,535 6,622
10,956
199,488 100
7,879
207,367
April 13, 2013
(1,000 eggs)
28,392 21,809
3,412 1,175 32,961 7,768 3,546 7,582 17,603 8,341
19,862 6,564 3,862 5,401
14,417 6,636
10,752
200,083 100
8,131
208,214
Broiler-Type Chicks Placed 19 Selected States and United States: 2013
State
March 9, 2013
March 16, 2013
Week ending
March 23, 2013
March 30, 2013
(1,000 chicks) (1,000 chicks) (1,000 chicks) (1,000 chicks)
Alabama ............................................. Arkansas ............................................ Delaware ............................................ Florida ................................................ Georgia .............................................. Kentucky ............................................. Louisiana ............................................ Maryland ............................................. Mississippi .......................................... Missouri ..............................................
20,548 20,875
4,419 1,488 27,148 6,481 2,968 6,163 14,731 5,144
21,200 20,533
3,583 1,224 27,044 6,240 3,020 6,281 14,961 5,502
21,182 20,406
4,602 1,141 26,878 6,691 2,994 5,503 14,896 5,769
20,553 21,409
3,808 1,291 26,254 5,585 3,288 6,642 14,374 5,560
April 6, 2013
(1,000 chicks)
21,761 20,019
4,213 1,224 26,381 6,333 3,056 5,548 15,113 5,418
April 13, 2013
(1,000 chicks)
20,898 19,104
3,685 1,328 26,592 5,867 3,116 6,691 14,917 5,954
North Carolina .................................... Oklahoma ........................................... Pennsylvania ...................................... South Carolina .................................... Texas ................................................. Virginia ............................................... California, Tennessee,
and West Virginia ..............................
16,412 4,797 2,992 4,442
12,194 4,451
9,490
16,208 4,364 3,011 3,894
12,425 5,087
10,135
16,298 4,171 2,947 3,898
12,471 4,856
9,854
15,778 3,390 3,118 4,811
12,133 5,052
11,250
15,739 4,005 2,990 4,644
12,612 5,851
10,178
15,028 4,439 3,178 4,744
12,676 4,854
10,523
19 State total ...................................... Percent of previous year .....................
164,743 101
164,712 101
164,557 100
164,296 99
165,085 100
163,594 100
Other States .......................................
5,866
5,508
5,767
5,690
5,837
6,438
United States ......................................
170,609
170,220
170,324
169,986
170,922
170,032
Average hatchability for chicks hatched in the 19 selected States during the week was 85 percent. Average hatchability is calculated by dividing chicks hatched during the week by eggs set three weeks earlier.