- Collection:
- Georgia Government Publications
- Serial:
- Broiler hatchery news release / United States Department of Agriculture National Agricultural Statistics Service.
- Title:
- Georgia broiler hatchery news release, 2013 March 20
- Creator:
- Georgia Crop Reporting Service
- Contributor to Resource:
- United States. National Agricultural Statistics Service. Southern Regional Field Office, issuing body.
Alabama. Department of Agriculture and Industries, issuing body.
Florida. Department of Agriculture and Consumer Services, issuing body.
Georgia. Department of Agriculture, issuing body.
South Carolina. Department of Agriculture, issuing body. - Publisher:
- Athens, Ga. : Georgia Agricultural Statistics Service
- Date of Original:
- 2013-03-20
- Subject:
- Poultry--Hatcheries--Georgia--Statistics
Eggs--Production--Georgia--Statistics - Location:
- United States, Georgia, 32.75042, -83.50018
- Medium:
- state government records
- Type:
- Text
- Format:
- application/pdf
- Description:
- Began with: August 28, 2013.
Effective March 12, 2014, name of issuing body appears as Southern Regional Field Office.
August 28, 2013; title from caption (Georgia Government Publications database, viewed January 19, 2018).
January 17, 2018 (received via e-mail on January 18, 2018 from Georgia Department of Agriculture); (Georgia Government Publications database, viewed November 22, 2017). - External Identifiers:
- Call Number GA A400.C7 P1 H2 2013/3-20
- Metadata URL:
- https://dlg.galileo.usg.edu/id:dlg_ggpd_i-ga-ba400-pc7-bp1-bh2-b2013-s3-h20-belec-p-btext
- Digital Object URL:
- https://dlg.galileo.usg.edu/do:dlg_ggpd_i-ga-ba400-pc7-bp1-bh2-b2013-s3-h20-belec-p-btext
- Language:
- eng
- Holding Institution:
- University of Georgia. Map and Government Information Library
- Rights:
-

United States Department of Agriculture National Agricultural Statistics Service
GA Broiler Hatchery News Release
In Cooperation with the Georgia Department of Agriculture Georgia Field Office 355 East Hancock Avenue, Suite 320 Athens, GA 30601 (706) 546-2236
www.nass.usda.gov
March 20, 2013
Media Contact: Douglas G. Kleweno nass-ga@nass.usda.gov
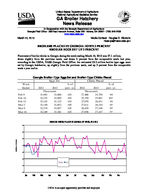
BROILERS PLACED IN GEORGIA DOWN 3 PERCENT BROILER EGGS SET UP 3 PERCENT
Placement of broiler chicks in Georgia during the week ending March 16, 2013 was 27.1 million, down slightly from the previous week, and down 3 percent from the comparable week last year, according to the USDA, NASS Georgia Field Office. An estimated 33.2 million broiler type eggs were set by Georgia hatcheries, up slightly from the previous week, and up 3 percent from the comparable week a year earlier.
Week Ended
Feb 9 Feb 16 Feb 23 Mar 2 Mar 9 Mar 16
Georgia Broiler-Type Eggs Set and Broiler-Type Chicks Placed
Eggs Set
Chicks Placed
% of
% of
2012
2013
prev. yr. 2012
2013
prev. yr.
Thous ands
Thous ands
31,983 33,088 103
27,488 25,750
94
32,222 33,069 103
25,370 25,981 102
32,143 33,125 103
27,970 26,431
94
32,150 33,852 105
27,611 26,310
95
32,374 33,057 102
28,429 27,148
95
32,249 33,182 103
27,958 27,147
97
BROILER CHICKS PLACED IN GEORGIA BY WEEK, 2012-2013
30
29
28
27
26
25
2012 2013
24
23
Jan Feb Mar Apr
May Jun Jul
Aug Sep
Oct Nov Dec
Million Chicks
USDA is an equal opportunity provider and employer.
Broiler-Type Eggs Set 19 Selected States and United States: 2013
State
February 9, 2013
February 16, 2013
Week ending
February 23, 2013
March 2, 2013
(1,000 eggs)
(1,000 eggs)
(1,000 eggs)
(1,000 eggs)
Alabama ............................................. Arkansas ............................................ Delaware ............................................ Florida ................................................ Georgia .............................................. Kentucky ............................................. Louisiana ............................................ Maryland ............................................. Mississippi .......................................... Missouri ..............................................
27,881 21,867
3,415 1,223 33,088 7,754 3,273 7,213 17,305 8,154
28,116 21,859
3,415 1,221 33,069 7,593 3,288 7,198 17,272 8,216
28,227 21,840
3,419 1,223 33,125 7,672 3,349 7,213 17,606 8,105
27,967 21,816
3,415 1,221 33,852 7,599 3,364 7,254 17,516 8,110
North Carolina .................................... Oklahoma ........................................... Pennsylvania ...................................... South Carolina .................................... Texas ................................................. Virginia ............................................... California, Tennessee,
and West Virginia ..............................
19,908 7,020 3,780 5,283
14,909 6,392
8,622
20,173 6,992 3,791 5,311
14,825 6,217
10,391
20,316 6,837 3,861 5,492
15,038 6,188
10,187
20,165 6,918 3,760 5,417
15,172 6,396
10,415
19 State total ...................................... Percent of previous year .....................
197,087 101
198,947 102
199,698 102
200,357 101
Other States .......................................
7,860
7,877
7,932
7,923
United States ......................................
204,947
206,824
207,630
208,280
March 9, 2013
(1,000 eggs)
27,434 21,772
3,409 1,221 33,057 7,648 3,379 7,453 16,957 8,268
20,085 6,886 3,949 5,333
15,223 6,661
10,617
199,352 100
7,989
207,341
March 16, 2013
(1,000 eggs)
28,113 21,156
3,412 1,221 33,182 7,668 3,395 7,457 17,869 7,938
19,926 6,909 3,877 5,275
15,238 6,653
10,906
200,195 101
8,001
208,196
Broiler-Type Chicks Placed 19 Selected States and United States: 2013
State
February 9, 2013
February 16, 2013
Week ending
February 23, 2013
March 2, 2013
(1,000 chicks) (1,000 chicks) (1,000 chicks) (1,000 chicks)
Alabama ............................................. Arkansas ............................................ Delaware ............................................ Florida ................................................ Georgia .............................................. Kentucky ............................................. Louisiana ............................................ Maryland ............................................. Mississippi .......................................... Missouri ..............................................
21,285 19,729
3,891 1,276 25,750 5,970 2,951 5,815 14,389 5,653
21,471 19,327
4,141 1,588 25,981 5,719 2,930 6,310 14,553 5,699
21,257 20,166
4,202 1,194 26,431 5,902 2,964 5,684 14,629 5,630
20,731 20,311
3,818 1,089 26,310 5,731 2,967 6,713 14,814 5,172
March 9, 2013
(1,000 chicks)
20,548 20,875
4,419 1,488 27,148 5,781 2,968 6,163 14,731 5,144
March 16, 2013
(1,000 chicks)
21,221 20,533
3,583 1,224 27,147 6,177 3,020 6,281 14,957 5,502
North Carolina .................................... Oklahoma ........................................... Pennsylvania ...................................... South Carolina .................................... Texas ................................................. Virginia ............................................... California, Tennessee,
and West Virginia ..............................
15,757 4,292 3,193 4,589
12,151 5,386
10,102
15,464 4,842 2,702 5,643
12,104 4,592
10,277
15,911 4,400 2,850 4,572
12,329 5,454
9,611
15,780 4,996 2,977 4,436
12,435 5,024
9,259
16,412 4,797 3,031 4,442
12,202 4,451
10,231
16,191 4,364 3,164 3,894
12,433 5,087
10,089
19 State total ...................................... Percent of previous year .....................
162,179 100
163,343 101
163,186 102
162,563 100
164,831 101
164,867 101
Other States .......................................
5,692
6,096
5,939
5,925
5,866
5,492
United States ......................................
167,871
169,439
169,125
168,488
170,697
170,359
Average hatchability for chicks hatched in the 19 selected States during the week was 85 percent. Average hatchability is calculated by dividing chicks hatched during the week by eggs set three weeks earlier.