United States Department of Agriculture National Agricultural Statistics Service
Broiler Hatchery News Release
In Cooperation with Alabama Department of Agriculture and Industries, Florida Department of Agriculture and Consumer Services, Georgia Department of Agriculture, and South Carolina Department of Agriculture
Southern Region 355 East Hancock Avenue, Suite 320 Athens, GA 30601 (706) 546-2236 www.nass.usda.gov
December 11 , 2013
Media Contact: Douglas G. Kleweno nassrfosor@nass.usda.gov
BROILER-TYPE EGGS SET AND BROILER-TYPE CHICKS PLACED
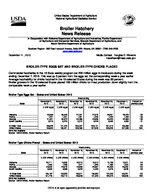
Commercial hatcheries in the 19 State weekly program set 200 million eggs in incubators during the week ending December 7, 2013. This was up 5 percent from the eggs set the corresponding week a year earlier. Average hatchability for chicks hatched in the 19 selected States during the week was 83 percent. Broiler growers in the 19 selected States placed 163 million chicks for meat production, down slightly from the comparable week a year earlier.
Broiler-Type Eggs Set States and United States: 2013
State
November 2, 2013
November 9, 2013
Week ending
November 16, November 23,
2013
2013
November 30, 2013
(1,000 eggs) (1,000 eggs) (1,000 eggs)
(1,000 eggs) (1,000 eggs)
December 7, Percent of
2013
previous year
(1,000 eggs)
Alabama .....................................
23,998
26,348
27,041
27,970
28,291
28,275
102
Florida ........................................
1,221
1,221
1,221
1,220
1,222
1,223
133
Georgia ......................................
31,621
30,872
33,386
32,985
33,423
32,994
109
South Carolina ............................
5,215
5,279
5,313
5,244
5,383
4,833
91
19 State Total ..............................
189,924
191,479
200,547
200,101
201,310
199,659
105
United States..........................
196,903
199,021
208,266
207,940
209,029
207,508
N/A
(N/A) Not Available Source: USDA-NASS, Broiler Hatchery Report.
Broiler-Type Chicks Placed States and United States: 2013
State
November 2, 2013
November 9, 2013
Week ending
November 16, November 23,
2013
2013
November 30, December 7,
2013
2013
Percent of previous year
(1,000 chicks) (1,000 chicks) (1,000 chicks) (1,000 chicks) (1,000 chicks) (1,000 chicks)
Alabama .....................................
20,711
19,650
20,210
18,512
19,735
19,921
94
Florida ........................................
1,395
1,298
1,271
1,328
1,469
1,354
99
Georgia ......................................
24,840
23,979
24,883
24,967
24,484
26,050
100
South Carolina ............................
3,908
4,886
5,023
4,448
4,878
4,948
98
19 State total...........................
156,182
153,825
159,971
156,063
157,025
163,251
100
United States.........................
161,776
159,710
165,906
161,545
162,573
168,936
N/A
(N/A) Not Available Source: USDA-NASS, Broiler Hatchery Report.
USDA is an equal opportunity provider and employer.
Broiler-Type Eggs Set 19 Selected States and United States: 2013
State
November 2, 2013
November 9, 2013
Week ending
November 16, November 23,
2013
2013
(1,000 eggs)
(1,000 eggs)
(1,000 eggs)
(1,000 eggs)
Alabama ............................................ Arkansas ............................................ Delaware ............................................ Florida ............................................... Georgia .............................................. Kentucky ............................................. Louisiana ............................................ Maryland ............................................. Mississippi .......................................... Missouri ..............................................
23,998 19,934
4,238 1,221 31,621 7,430 3,728 7,614 15,510 7,420
26,348 20,294
4,198 1,221 30,872 7,440 3,607 7,648 16,467 7,543
27,041 21,236
4,241 1,221 33,386 7,891 3,818 7,940 17,193 8,491
27,970 21,163
4,411 1,220 32,985 7,739 3,622 7,934 17,063 8,488
November 30, 2013
(1,000 eggs)
28,291 21,149
4,414 1,222 33,423 7,703 3,864 7,596 17,528 8,491
North Carolina .................................... Oklahoma ........................................... Pennsylvania ...................................... South Carolina .................................. Texas ................................................. Virginia ............................................... California, Tennessee,
and West Virginia ..............................
20,099 6,965 3,752 5,215
14,935 6,032
10,212
19,940 6,998 3,991 5,279
14,037 6,008
9,588
20,587 7,042 3,937 5,313
14,115 6,494
10,601
20,521 7,093 3,917 5,244
14,271 6,421
10,039
19,775 6,958 4,067 5,383
14,982 6,370
10,094
19 State total ...................................... Percent of previous year .....................
189,924 105
191,479 101
200,547 102
200,101 102
201,310 100
Other States .......................................
6,979
7,542
7,719
7,839
7,719
United States ......................................
196,903
199,021
208,266
207,940
209,029
December 7, 2013
(1,000 eggs)
28,275 21,175
4,435 1,223 32,994 7,701 3,803 7,717 17,547 8,466
20,105 6,934 3,887 4,833
13,972 6,373
10,219
199,659 105
7,849
207,508
Broiler-Type Chicks Placed 19 Selected States and United States: 2013
State
November 2, 2013
November 9, 2013
Week ending
November 16, November 23,
2013
2013
(1,000 chicks) (1,000 chicks) (1,000 chicks) (1,000 chicks)
Alabama ............................................ Arkansas ............................................ Delaware ............................................ Florida ............................................... Georgia .............................................. Kentucky ............................................. Louisiana ............................................ Maryland ............................................. Mississippi .......................................... Missouri ..............................................
20,711 18,857
5,938 1,395 24,840 6,104 3,018 4,424 13,314 5,949
19,650 17,587
5,670 1,298 23,979 4,755 3,011 4,578 14,007 5,289
20,210 18,330
4,415 1,271 24,883 5,745 3,535 7,082 14,741 4,675
18,512 18,731
5,476 1,328 24,967 5,962 3,162 5,292 13,202 4,523
November 30, 2013
(1,000 chicks)
19,735 19,328
5,402 1,469 24,484 6,080 3,052 5,164 13,819 5,990
December 7, 2013
(1,000 chicks)
19,921 19,770
6,107 1,354 26,050 6,248 3,340 4,416 14,379 6,182
North Carolina .................................... Oklahoma ........................................... Pennsylvania ...................................... South Carolina .................................. Texas ................................................. Virginia ............................................... California, Tennessee,
and West Virginia ..............................
14,636 3,738 3,118 3,908
11,360 5,532
9,340
15,424 5,038 3,135 4,886
11,115 5,591
8,812
15,857 5,113 2,693 5,023
12,553 4,911
8,934
15,915 5,126 2,915 4,448
12,345 5,262
8,897
15,345 3,473 3,138 4,878
11,628 4,835
9,205
15,866 4,268 3,092 4,948
11,752 5,003
10,555
19 State total ...................................... Percent of previous year .....................
156,182 103
153,825 104
159,971 103
156,063 103
157,025 98
163,251 100
Other States .......................................
5,594
5,885
5,935
5,482
5,548
5,685
United States ......................................
161,776
159,710
165,906
161,545
162,573
168,936
Source: USDA-NASS, Broiler Hatchery Report
USDA is an equal opportunity provider and employer.
