United States Department of Agriculture National Agricultural Statistics Service
Broiler Hatchery News Release
In Cooperation with Alabama Department of Agriculture and Industries, Florida Department of Agriculture and Consumer Services, Georgia Department of Agriculture, and South Carolina Department of Agriculture
Southern Region 355 East Hancock Avenue, Suite 320 Athens, GA 30601 (706) 546-2236 www.nass.usda.gov
November 27 , 2013
Media Contact: Douglas G. Kleweno nassrfosor@nass.usda.gov
BROILER-TYPE EGGS SET AND BROILER-TYPE CHICKS PLACED
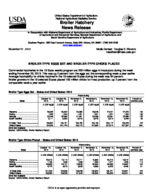
Commercial hatcheries in the 19 State weekly program set 200 million eggs in incubators during the week ending November 23, 2013. This was up 2 percent from the eggs set the corresponding week a year earlier. Average hatchability for chicks hatched in the 19 selected States during the week was 84 percent. Broiler growers in the 19 selected States placed 155 million chicks for meat production, up 2 percent from the comparable week a year earlier.
Broiler-Type Eggs Set States and United States: 2013
State
October 19, 2013
October 26, 2013
Week ending
November 2, 2013
November 9, 2013
November 16, November 23, Percent of
2013
2013
previous year
(1,000 eggs) (1,000 eggs) (1,000 eggs)
(1,000 eggs) (1,000 eggs)
(1,000 eggs)
Alabama .....................................
26,362
25,594
23,998
26,348
27,041
27,970
100
Florida ........................................
1,223
1,224
1,221
1,221
1,221
1,220
100
Georgia ......................................
30,445
32,569
31,621
30,498
33,361
32,989
102
South Carolina ............................
5,111
5,390
5,215
5,279
5,313
5,244
93
19 State Total ..............................
186,897
194,181
189,749
190,155
200,112
199,875
102
United States..........................
194,329
201,724
196,718
197,662
207,814
207,597
N/A
(N/A) Not Available Source: USDA-NASS, Broiler Hatchery Report.
Broiler-Type Chicks Placed States and United States: 2013
State
October 19, 2013
October 26, 2013
Week ending
November 2, November 9,
2013
2013
November 16, November 23, Percent of
2013
2013
previous year
(1,000 chicks) (1,000 chicks) (1,000 chicks) (1,000 chicks) (1,000 chicks) (1,000 chicks)
Alabama .....................................
20,510
18,114
20,711
19,650
20,210
18,512
104
Florida ........................................
1,109
1,306
1,395
1,298
1,271
1,328
114
Georgia ......................................
26,605
24,101
24,840
23,840
24,883
24,967
100
South Carolina ............................
4,772
4,518
3,908
4,886
5,023
4,448
91
19 State total...........................
161,234
152,805
156,246
153,924
159,721
154,821
102
United States.........................
166,588
158,006
161,840
159,809
165,655
160,301
N/A
(N/A) Not Available Source: USDA-NASS, Broiler Hatchery Report.
USDA is an equal opportunity provider and employer.
Broiler-Type Eggs Set 19 Selected States and United States: 2013
State
October 19, 2013
October 26, 2013
Week ending
November 2, 2013
November 9, 2013
(1,000 eggs)
(1,000 eggs)
(1,000 eggs)
(1,000 eggs)
Alabama ............................................ Arkansas ............................................ Delaware ............................................ Florida ............................................... Georgia .............................................. Kentucky ............................................. Louisiana ............................................ Maryland ............................................. Mississippi .......................................... Missouri ..............................................
26,362 19,004
4,301 1,223 30,445 6,519 3,486 7,399 16,375 8,070
25,594 19,587
4,267 1,224 32,569 7,249 3,879 7,793 17,295 7,678
23,998 19,767
4,238 1,221 31,621 7,384 3,728 7,614 15,510 7,420
26,348 20,082
4,198 1,221 30,498 7,128 3,607 7,648 16,467 7,543
November 16, 2013
(1,000 eggs)
27,041 21,269
4,241 1,221 33,361 7,628 3,818 7,940 17,193 8,491
November 23, 2013
(1,000 eggs)
27,970 20,997
4,410 1,220 32,989 7,739 3,622 7,920 17,064 8,488
North Carolina .................................... Oklahoma ........................................... Pennsylvania ...................................... South Carolina .................................. Texas ................................................. Virginia ............................................... California, Tennessee,
and West Virginia ..............................
19,675 6,609 3,841 5,111
13,428 6,343
8,706
19,824 6,685 3,293 5,390
15,128 6,661
10,065
20,099 6,965 3,752 5,215
14,943 6,032
10,242
19,940 6,589 3,991 5,279
14,046 6,008
9,562
20,420 7,042 3,938 5,313
14,118 6,494
10,584
20,512 7,093 3,869 5,244
14,274 6,421
10,043
19 State total ...................................... Percent of previous year .....................
186,897 105
194,181 104
189,749 105
190,155 100
200,112 102
199,875 102
Other States .......................................
7,432
7,543
6,969
7,507
7,702
7,722
United States ......................................
194,329
201,724
196,718
197,662
207,814
207,597
Broiler-Type Chicks Placed 19 Selected States and United States: 2013
State
October 19, 2013
October 26, 2013
Week ending
November 2, 2013
November 9, 2013
(1,000 chicks) (1,000 chicks) (1,000 chicks) (1,000 chicks)
Alabama ............................................ Arkansas ............................................ Delaware ............................................ Florida ............................................... Georgia .............................................. Kentucky ............................................. Louisiana ............................................ Maryland ............................................. Mississippi .......................................... Missouri ..............................................
20,510 19,797
4,308 1,109 26,605 6,026 3,234 6,381 13,655 5,545
18,114 18,190
5,285 1,306 24,101 5,604 2,845 5,926 12,295 5,116
20,711 18,864
5,938 1,395 24,840 6,104 3,018 4,424 13,314 5,949
19,650 17,588
5,670 1,298 23,840 4,755 3,011 4,578 14,007 5,289
November 16, 2013
(1,000 chicks)
20,210 18,330
4,415 1,271 24,883 5,745 3,535 7,082 14,741 4,675
November 23, 2013
(1,000 chicks)
18,512 18,614
5,106 1,328 24,967 4,962 3,162 5,943 13,162 4,523
North Carolina .................................... Oklahoma ........................................... Pennsylvania ...................................... South Carolina .................................. Texas ................................................. Virginia ............................................... California, Tennessee,
and West Virginia ..............................
16,311 3,962 2,737 4,772
11,928 4,820
9,534
15,524 5,410 3,100 4,518
11,116 4,629
9,726
14,659 3,738 3,118 3,908
11,360 5,532
9,374
15,492 5,038 3,135 4,886
11,122 5,591
8,974
15,761 5,113 2,693 5,023
12,560 4,872
8,812
16,168 5,126 2,957 4,448
12,352 4,698
8,793
19 State total ...................................... Percent of previous year .....................
161,234 104
152,805 97
156,246 103
153,924 104
159,721 102
154,821 102
Other States .......................................
5,354
5,201
5,594
5,885
5,934
5,480
United States ......................................
166,588
158,006
161,840
159,809
165,655
160,301
Source: USDA-NASS, Broiler Hatchery Report
USDA is an equal opportunity provider and employer.
