- Collection:
- Georgia Government Publications
- Serial:
- Broiler hatchery news release / United States Department of Agriculture National Agricultural Statistics Service.
- Title:
- Georgia broiler hatchery news release, 2013 November 20
- Creator:
- Georgia Crop Reporting Service
- Contributor to Resource:
- United States. National Agricultural Statistics Service. Southern Regional Field Office, issuing body.
Alabama. Department of Agriculture and Industries, issuing body.
Florida. Department of Agriculture and Consumer Services, issuing body.
Georgia. Department of Agriculture, issuing body.
South Carolina. Department of Agriculture, issuing body. - Publisher:
- Athens, Ga. : Georgia Agricultural Statistics Service
- Date of Original:
- 2013-11-20
- Subject:
- Poultry--Hatcheries--Georgia--Statistics
Eggs--Production--Georgia--Statistics - Location:
- United States, Georgia, 32.75042, -83.50018
- Medium:
- state government records
- Type:
- Text
- Format:
- application/pdf
- Description:
- Began with: August 28, 2013.
Effective March 12, 2014, name of issuing body appears as Southern Regional Field Office.
August 28, 2013; title from caption (Georgia Government Publications database, viewed January 19, 2018).
January 17, 2018 (received via e-mail on January 18, 2018 from Georgia Department of Agriculture); (Georgia Government Publications database, viewed November 22, 2017). - External Identifiers:
- Call Number GA A400.C7 P1 H2 2013/11-20
- Metadata URL:
- https://dlg.galileo.usg.edu/id:dlg_ggpd_i-ga-ba400-pc7-bp1-bh2-b2013-s11-h20-belec-p-btext
- Digital Object URL:
- https://dlg.galileo.usg.edu/do:dlg_ggpd_i-ga-ba400-pc7-bp1-bh2-b2013-s11-h20-belec-p-btext
- Language:
- eng
- Holding Institution:
- University of Georgia. Map and Government Information Library
- Rights:
-

United States Department of Agriculture National Agricultural Statistics Service
Broiler Hatchery News Release
In Cooperation with Alabama Department of Agriculture and Industries, Florida Department of Agriculture and Consumer Services, Georgia Department of Agriculture, and South Carolina Department of Agriculture
Southern Region 355 East Hancock Avenue, Suite 320 Athens, GA 30601 (706) 546-2236 www.nass.usda.gov
November 20 , 2013
Media Contact: Douglas G. Kleweno nassrfosor@nass.usda.gov
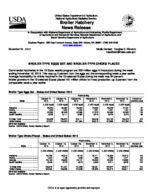
BROILER-TYPE EGGS SET AND BROILER-TYPE CHICKS PLACED
Commercial hatcheries in the 19 State weekly program set 200 million eggs in incubators during the week ending November 16, 2013. This was up 2 percent from the eggs set the corresponding week a year earlier. Average hatchability for chicks hatched in the 19 selected States during the week was 84 percent. Broiler growers in the 19 selected States placed 161 million chicks for meat production, up 3 percent from the comparable week a year earlier.
Broiler-Type Eggs Set States and United States: 2013
State
October 12, 2013
October 19, 2013
Week ending
October 26, 2013
November 2, 2013
November 9, November 16, Percent of
2013
2013
previous year
(1,000 eggs) (1,000 eggs) (1,000 eggs)
(1,000 eggs) (1,000 eggs)
(1,000 eggs)
Alabama .....................................
26,225
26,362
25,594
23,980
26,348
27,041
97
Florida ........................................
1,222
1,223
1,224
1,221
1,221
1,221
100
Georgia ......................................
32,080
30,445
32,569
31,372
30,498
33,522
104
South Carolina ............................
5,030
5,111
5,390
5,215
5,279
5,313
98
19 State Total ..............................
190,356
186,870
194,111
189,046
190,158
199,918
102
United States..........................
197,841
194,302
201,654
196,015
197,665
207,620
N/A
(N/A) Not Available Source: USDA-NASS, Broiler Hatchery Report.
Broiler-Type Chicks Placed States and United States: 2013
State
October 12, 2013
October 19, 2013
Week ending
October 26, 2013
November 2, 2013
November 9, November 16, Percent of
2013
2013
previous year
(1,000 chicks) (1,000 chicks) (1,000 chicks) (1,000 chicks) (1,000 chicks) (1,000 chicks)
Alabama .....................................
20,786
20,510
18,120
20,711
19,650
20,210
104
Florida ........................................
1,054
1,109
1,306
1,395
1,298
1,271
96
Georgia ......................................
25,108
26,605
24,101
24,840
23,840
24,883
100
South Carolina ............................
4,348
4,772
4,518
3,908
4,211
5,023
120
19 State total...........................
156,876
161,031
151,885
156,431
152,927
160,677
103
United States.........................
162,403
166,385
157,086
162,025
158,812
166,611
N/A
(N/A) Not Available Source: USDA-NASS, Broiler Hatchery Report.
USDA is an equal opportunity provider and employer.
Broiler-Type Eggs Set 19 Selected States and United States: 2013
State
October 12, 2013
October 19, 2013
Week ending
October 26, 2013
November 2, 2013
(1,000 eggs)
(1,000 eggs)
(1,000 eggs)
(1,000 eggs)
Alabama ............................................ Arkansas ............................................ Delaware ............................................ Florida ............................................... Georgia .............................................. Kentucky ............................................. Louisiana ............................................ Maryland ............................................. Mississippi .......................................... Missouri ..............................................
26,225 19,519
4,257 1,222 32,080 7,631 3,456 7,917 15,712 8,427
26,362 19,004
4,301 1,223 30,445 6,492 3,486 7,399 16,375 8,070
25,594 19,587
4,267 1,224 32,569 7,202 3,879 7,793 17,295 7,678
23,980 19,767
4,238 1,221 31,372 7,249 3,728 7,614 15,510 7,420
North Carolina .................................... Oklahoma ........................................... Pennsylvania ...................................... South Carolina .................................. Texas ................................................. Virginia ............................................... California, Tennessee,
and West Virginia ..............................
18,506 6,337 3,871 5,030
13,840 6,370
9,956
19,675 6,609 3,841 5,111
13,428 6,343
8,706
19,824 6,685 3,293 5,390
15,128 6,661
10,042
20,099 6,965 3,752 5,215
14,943 6,032
9,941
19 State total ...................................... Percent of previous year .....................
190,356 105
186,870 105
194,111 104
189,046 105
Other States .......................................
7,485
7,432
7,543
6,969
United States ......................................
197,841
194,302
201,654
196,015
November 9, 2013
(1,000 eggs)
26,348 20,082
4,201 1,221 30,498 7,128 3,607 7,648 16,467 7,543
November 16, 2013
(1,000 eggs)
27,041 21,269
4,241 1,221 33,522 7,628 3,818 7,940 17,193 8,491
19,940 6,589 3,991 5,279
14,046 6,008
20,512 7,042 3,774 5,313
14,118 6,494
9,562
10,301
190,158 100
199,918 102
7,507
7,702
197,665
207,620
Broiler-Type Chicks Placed 19 Selected States and United States: 2013
State
October 12, 2013
October 19, 2013
Week ending
October 26, 2013
November 2, 2013
(1,000 chicks) (1,000 chicks) (1,000 chicks) (1,000 chicks)
Alabama ............................................ Arkansas ............................................ Delaware ............................................ Florida ............................................... Georgia .............................................. Kentucky ............................................. Louisiana ............................................ Maryland ............................................. Mississippi .......................................... Missouri ..............................................
20,786 18,435
4,769 1,054 25,108 5,620 3,249 5,049 13,636 5,471
20,510 19,797
4,344 1,109 26,605 6,026 3,234 6,142 13,655 5,545
18,120 18,190
4,362 1,306 24,101 5,604 2,845 5,923 12,295 5,116
20,711 18,864
5,095 1,395 24,840 6,125 3,018 5,519 13,314 5,949
November 9, 2013
(1,000 chicks)
19,650 17,588
4,637 1,298 23,840 4,815 3,011 5,229 14,007 5,289
November 16, 2013
(1,000 chicks)
20,210 18,330
5,055 1,271 24,883 5,733 3,535 7,452 14,741 4,675
North Carolina .................................... Oklahoma ........................................... Pennsylvania ...................................... South Carolina .................................. Texas ................................................. Virginia ............................................... California, Tennessee,
and West Virginia ..............................
14,921 4,531 2,961 4,348
11,584 5,778
9,576
16,311 3,962 2,737 4,772
11,928 4,820
9,534
15,524 5,410 3,100 4,518
11,116 4,629
9,726
14,659 3,738 3,118 3,908
11,360 5,532
9,286
15,492 5,038 3,135 4,211
11,122 5,591
8,974
15,761 5,113 2,580 5,023
12,560 4,872
8,883
19 State total ...................................... Percent of previous year .....................
156,876 101
161,031 104
151,885 97
156,431 103
152,927 103
160,677 103
Other States .......................................
5,527
5,354
5,201
5,594
5,885
5,934
United States ......................................
162,403
166,385
157,086
162,025
158,812
166,611
Source: USDA-NASS, Broiler Hatchery Report
USDA is an equal opportunity provider and employer.