- Collection:
- Georgia Government Publications
- Serial:
- Broiler hatchery news release / United States Department of Agriculture National Agricultural Statistics Service.
- Title:
- Georgia broiler hatchery news release, 2012 September 12
- Creator:
- Georgia Crop Reporting Service
- Contributor to Resource:
- United States. National Agricultural Statistics Service. Southern Regional Field Office, issuing body.
Alabama. Department of Agriculture and Industries, issuing body.
Florida. Department of Agriculture and Consumer Services, issuing body.
Georgia. Department of Agriculture, issuing body.
South Carolina. Department of Agriculture, issuing body. - Publisher:
- Athens, Ga. : Georgia Agricultural Statistics Service
- Date of Original:
- 2012-09-12
- Subject:
- Poultry--Hatcheries--Georgia--Statistics
Eggs--Production--Georgia--Statistics - Location:
- United States, Georgia, 32.75042, -83.50018
- Medium:
- state government records
- Type:
- Text
- Format:
- application/pdf
- Description:
- Began with: August 28, 2013.
Effective March 12, 2014, name of issuing body appears as Southern Regional Field Office.
August 28, 2013; title from caption (Georgia Government Publications database, viewed January 19, 2018).
January 17, 2018 (received via e-mail on January 18, 2018 from Georgia Department of Agriculture); (Georgia Government Publications database, viewed November 22, 2017). - External Identifiers:
- Call Number GA A400.C7 P1 H2 2012/9-12
- Metadata URL:
- https://dlg.galileo.usg.edu/id:dlg_ggpd_i-ga-ba400-pc7-bp1-bh2-b2012-s9-h12-belec-p-btext
- Digital Object URL:
- https://dlg.galileo.usg.edu/do:dlg_ggpd_i-ga-ba400-pc7-bp1-bh2-b2012-s9-h12-belec-p-btext
- Language:
- eng
- Holding Institution:
- University of Georgia. Map and Government Information Library
- Rights:
-

United States Department of Agriculture National Agricultural Statistics Service
GA Broiler Hatchery News Release
In Cooperation with the Georgia Department of Agriculture Georgia Field Office 355 East Hancock Avenue, Suite 320 Athens, GA 30601 (706) 546-2236
www.nass.usda.gov
September 12, 2012
Media Contact: Douglas G. Kleweno nass-ga@nass.usda.gov
BROILERS PLACED IN GEORGIA DOWN SLIGHTLY BROILER EGGS DOWN 1 PERCENT
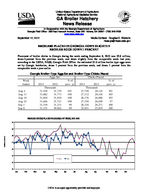
Placement of broiler chicks in Georgia during the week ending September 8, 2012 was 25.8 million, down 2 percent from the previous week, and down slightly from the comparable week last year, according to the USDA, NASS, Georgia Field Office. An estimated 31.0 million broiler type eggs were set by Georgia hatcheries, down 1 percent from the previous week, and down 1 percent from the comparable week a year earlier.
Georgia Broiler-Type Eggs Set and Broiler-Type Chicks Placed
Eggs Set
Chicks Placed
Week
% of
% of
Ended
2011
2012
prev. yr. 2011
2012
prev. yr.
Thousands
Thousands
Aug 4
31,538 31,739 101
27,750 28,124 101
Aug 11
31,682 31,773 100
27,112 28,416 105
Aug 18
31,810 31,810 100
26,176 26,860 103
Aug 25
31,646 31,721 100
27,358 26,659
97
Sep 1
31,519 31,331
99
26,316 26,271 100
Sep 8
31,151 30,962
99
25,851 25,819 100
BROILER CHICKS PLACED IN GEORGIA BY WEEK, 2011-2012
30
29
28
27
26
25
2011
2012
24
23
Jan
Feb
Mar
Apr
May
Jun
Jul
Aug
Sep
Oct
Nov
Dec
Million Chicks
USDA is an equal opportunity provider and employer.
Broiler-Type Eggs Set 19 Selected States: 2012
State
Alabama .............................................. Arkansas ............................................. Delaware ............................................. Florida ................................................. Georgia ................................................ Kentucky .............................................. Louisiana ............................................. Maryland .............................................. Mississippi ........................................... Missouri ...............................................
August 4, 2012
(1,000 eggs)
27,360 21,130
3,497 1,353 31,739 7,601 3,165 7,595 17,667 7,863
North Carolina ..................................... Oklahoma ............................................ Pennsylvania ....................................... South Carolina ..................................... Texas ................................................... Virginia ................................................ California, Tennessee,
and West Virginia ..............................
19,600 6,476 3,538 5,313
14,394 6,089
10,678
19 State total .......................................
195,058
Previous year total ...............................
195,036
Percent of previous year .....................
100
August 11, 2012
(1,000 eggs)
27,840 21,057
3,279 1,352 31,773 7,738 3,211 7,254 17,075 8,036
19,222 6,276 3,398 5,328
13,789 6,074
10,322
193,024
194,164
99
Week ending
August 18, 2012
August 25, 2012
(1,000 eggs)
(1,000 eggs)
27,300 20,944
3,176 1,353 31,810 7,622 3,135 7,341 16,724 8,022
27,927 20,651
3,286 1,349 31,721 7,641 3,167 7,346 16,168 8,032
19,474 6,891 3,655 5,173
13,066 6,043
19,688 6,686 3,726 5,265
13,491 6,049
10,053
10,316
191,782
192,509
193,090
193,007
99
100
September 1, 2012
(1,000 eggs)
27,163 20,757
3,259 1,347 31,331 7,616 3,211 6,944 16,326 7,708
19,445 6,693 3,584 4,721
12,731 5,985
10,521
189,342
189,258
100
September 8, 2012
(1,000 eggs)
26,639 19,074
3,143 1,353 30,962 7,249 3,285 6,932 16,513 8,037
18,217 6,539 3,532 5,402
13,540 5,798
10,110
186,325
185,218
101
Broiler-Type Chicks Placed 19 Selected States: 2012
State
Alabama .............................................. Arkansas ............................................. Delaware ............................................. Florida ................................................. Georgia ................................................ Kentucky .............................................. Louisiana ............................................. Maryland .............................................. Mississippi ........................................... Missouri ...............................................
August 4, 2012
(1,000 chicks)
19,749 17,406
3,361 1,138 28,124 6,483 3,067 6,452 15,326 6,071
August 11, 2012
(1,000 chicks)
19,688 18,903
4,085 1,010 28,416 6,683 2,794 6,135 15,357 5,711
Week ending
August 18, 2012
August 25, 2012
(1,000 chicks) (1,000 chicks)
19,872 19,160
4,394 1,304 26,860 5,893 2,796 6,483 15,258 5,029
20,005 19,431
4,577 1,248 26,659 6,126 2,836 5,682 15,202 5,723
September 1, 2012
(1,000 chicks)
20,056 19,027
4,947 1,186 26,271 6,404 2,871 5,738 14,397 5,854
September 8, 2012
(1,000 chicks)
19,993 20,937
4,023 1,105 25,819 6,403 2,857 6,350 14,411 4,937
North Carolina ..................................... Oklahoma ............................................ Pennsylvania ....................................... South Carolina ..................................... Texas ................................................... Virginia ................................................ California, Tennessee,
and West Virginia ..............................
16,407 4,914 3,157 4,033
12,169 5,327
10,479
15,503 3,896 2,911 4,049
12,224 5,224
9,857
15,323 4,892 2,901 4,453
12,010 4,721
11,038
15,684 4,163 2,953 4,587
11,882 4,918
10,797
15,827 4,437 2,838 3,847
11,448 3,877
11,021
15,780 3,843 3,038 5,263
10,650 4,503
9,684
19 State total .......................................
163,663
162,446
162,387
162,473
160,046
159,596
Previous year total ...............................
164,050
162,336
161,039
162,943
160,923
160,203
Percent of previous year .....................
100
100
101
100
99
100
Average hatchability for chicks hatched in the 19 selected States during the week was 85 percent. Average hatchability is calculated by dividing chicks hatched during the week by eggs set three weeks earlier.