- Collection:
- Georgia Government Publications
- Serial:
- Broiler hatchery news release / United States Department of Agriculture National Agricultural Statistics Service.
- Title:
- Georgia broiler hatchery news release, 2012 August 8
- Creator:
- Georgia Crop Reporting Service
- Contributor to Resource:
- United States. National Agricultural Statistics Service. Southern Regional Field Office, issuing body.
Alabama. Department of Agriculture and Industries, issuing body.
Florida. Department of Agriculture and Consumer Services, issuing body.
Georgia. Department of Agriculture, issuing body.
South Carolina. Department of Agriculture, issuing body. - Publisher:
- Athens, Ga. : Georgia Agricultural Statistics Service
- Date of Original:
- 2012-08-08
- Subject:
- Poultry--Hatcheries--Georgia--Statistics
Eggs--Production--Georgia--Statistics - Location:
- United States, Georgia, 32.75042, -83.50018
- Medium:
- state government records
- Type:
- Text
- Format:
- application/pdf
- Description:
- Began with: August 28, 2013.
Effective March 12, 2014, name of issuing body appears as Southern Regional Field Office.
August 28, 2013; title from caption (Georgia Government Publications database, viewed January 19, 2018).
January 17, 2018 (received via e-mail on January 18, 2018 from Georgia Department of Agriculture); (Georgia Government Publications database, viewed November 22, 2017). - External Identifiers:
- Call Number GA A400.C7 P1 H2 2012/8-8
- Metadata URL:
- https://dlg.galileo.usg.edu/id:dlg_ggpd_i-ga-ba400-pc7-bp1-bh2-b2012-s8-h8-belec-p-btext
- Digital Object URL:
- https://dlg.galileo.usg.edu/do:dlg_ggpd_i-ga-ba400-pc7-bp1-bh2-b2012-s8-h8-belec-p-btext
- Language:
- eng
- Holding Institution:
- University of Georgia. Map and Government Information Library
- Rights:
-

United States Department of Agriculture National Agricultural Statistics Service
GA Broiler Hatchery News Release
In Cooperation with the Georgia Department of Agriculture Georgia Field Office 355 East Hancock Avenue, Suite 320 Athens, GA 30601 (706) 546-2236
www.nass.usda.gov
August 8, 2012
Media Contact: Douglas G. Kleweno nass-ga@nass.usda.gov
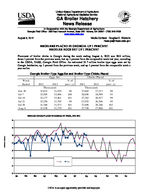
BROILERS PLACED IN GEORGIA UP 1 PERCENT BROILER EGGS SET UP 1 PERCENT
Placement of broiler chicks in Georgia during the week ending August 4, 2012 was 28.0 million, down 1 percent from the previous week, but up 1 percent from the comparable week last year, according to the USDA, NASS, Georgia Field Office. An estimated 31.7 million broiler type eggs were set by Georgia hatcheries, up 1 percent from the previous week, and up 1 percent from the comparable week a year earlier.
Georgia Broiler-Type Eggs Set and Broiler-Type Chicks Placed
Eggs Set
Chicks Placed
Week
% of
% of
Ended
2011
2012
prev. yr. 2011
2012
prev. yr.
Th ou s an ds
Tho us and s
Jun 30
32,833 31,470
96
27,665 27,213
98
Jul 7
32,505 32,496 100
28,696 26,599
93
Jul 14
32,177 32,461 101
27,282 26,917
99
Jul 21
32,256 31,795
99
27,925 26,546
95
Jul 28
31,388 31,573 101
27,696 28,246 102
Aug 4
31,538 31,739 101
27,750 27,968 101
BROILER CHICKS PLACED IN GEORGIA BY WEEK, 2011-2012
30
29
28
27
26
25 2011 2012
24
23
Jan
Feb
Mar
Apr
May
Jun
Jul
Aug
Sep
Oct
Nov
Dec
Million Chicks
USDA is an equal opportunity provider and employer.
Broiler-Type Eggs Set 19 Selected States: 2012
State
Alabama .............................................. Arkansas ............................................. Delaware ............................................. Florida ................................................. Georgia ................................................ Kentucky .............................................. Louisiana ............................................. Maryland .............................................. Mississippi ........................................... Missouri ...............................................
June 30, 2012
(1,000 eggs)
27,719 20,976
3,570 1,352 31,470 7,101 3,440 7,401 17,823 7,774
North Carolina ..................................... Oklahoma ............................................ Pennsylvania ....................................... South Carolina ..................................... Texas ................................................... Virginia ................................................ California, Tennessee,
and West Virginia ..............................
19,537 6,550 3,600 5,559
14,252 6,340
11,253
19 State total .......................................
195,717
Previous year total ...............................
197,158
Percent of previous year .....................
99
July 7, 2012
(1,000 eggs)
27,313 20,278
3,371 1,353 32,496 7,452 3,258 7,045 17,655 7,388
19,825 6,798 3,616 5,306
14,138 5,854
10,693
193,839
194,961
99
Week ending
July 14, 2012
July 21, 2012
(1,000 eggs)
(1,000 eggs)
27,908 19,621
3,295 1,352 32,461 7,718 3,409 7,351 18,063 8,068
27,813 19,931
3,503 1,341 31,795 7,843 3,107 7,220 17,691 8,024
19,816 6,465 3,767 5,298
14,612 6,222
19,628 6,696 3,535 5,319
14,500 6,217
10,770
10,720
196,196
194,883
196,576
195,141
100
100
July 28, 2012
(1,000 eggs)
28,149 20,915
3,501 1,352 31,573 7,811 3,167 7,600 17,838 7,835
19,638 6,714 3,535 5,603
14,254 6,182
10,675
196,342
194,434
101
August 4, 2012
(1,000 eggs)
27,630 21,130
3,497 1,353 31,739 7,644 3,227 7,595 17,667 7,863
19,510 6,476 3,463 5,313
14,394 6,089
10,754
195,344
195,036
100
Broiler-Type Chicks Placed 19 Selected States: 2012
State
Alabama .............................................. Arkansas ............................................. Delaware ............................................. Florida ................................................. Georgia ................................................ Kentucky .............................................. Louisiana ............................................. Maryland .............................................. Mississippi ........................................... Missouri ...............................................
June 30, 2012
(1,000 chicks)
20,806 19,778
3,787 1,079 27,213 6,540 3,066 6,947 15,520 5,952
July 7, 2012
(1,000 chicks)
19,941 20,381
4,720 1,234 26,599 5,906 2,913 5,716 14,915 5,111
Week ending
July 14, 2012
July 21, 2012
(1,000 chicks) (1,000 chicks)
20,301 19,209
4,989 1,168 26,917 5,873 2,961 5,582 15,485 5,064
20,525 20,502
4,250 1,179 26,546 6,142 3,098 7,131 15,216 4,708
July 28, 2012
(1,000 chicks)
19,417 19,313
3,153 1,211 28,246 5,925 2,935 6,093 14,933 5,159
August 4, 2012
(1,000 chicks)
19,765 17,406
3,361 1,138 27,968 6,466 3,067 6,452 15,326 6,071
North Carolina ..................................... Oklahoma ............................................ Pennsylvania ....................................... South Carolina ..................................... Texas ................................................... Virginia ................................................ California, Tennessee,
and West Virginia ..............................
15,485 4,776 3,014 5,077
12,312 4,900
9,519
15,844 4,248 3,020 4,831
12,127 4,294
11,849
15,714 4,343 3,003 4,524
12,156 4,712
11,189
16,227 4,335 2,962 4,142
11,930 4,312
10,675
15,898 4,151 3,006 4,273
11,905 5,383
10,259
16,407 4,914 3,168 4,033
12,169 5,327
10,582
19 State total .......................................
165,771
163,649
163,190
163,880
161,260
163,620
Previous year total ...............................
168,718
165,957
164,445
162,828
162,898
164,050
Percent of previous year .....................
98
99
99
101
99
100
Average hatchability for chicks hatched in the 19 selected States during the week was 85 percent. Average hatchability is calculated by dividing chicks hatched during the week by eggs set three weeks earlier.