- Collection:
- Georgia Government Publications
- Serial:
- Broiler hatchery news release / United States Department of Agriculture National Agricultural Statistics Service.
- Title:
- Georgia broiler hatchery news release, 2012 August 29
- Creator:
- Georgia Crop Reporting Service
- Contributor to Resource:
- United States. National Agricultural Statistics Service. Southern Regional Field Office, issuing body.
Alabama. Department of Agriculture and Industries, issuing body.
Florida. Department of Agriculture and Consumer Services, issuing body.
Georgia. Department of Agriculture, issuing body.
South Carolina. Department of Agriculture, issuing body. - Publisher:
- Athens, Ga. : Georgia Agricultural Statistics Service
- Date of Original:
- 2012-08-29
- Subject:
- Poultry--Hatcheries--Georgia--Statistics
Eggs--Production--Georgia--Statistics - Location:
- United States, Georgia, 32.75042, -83.50018
- Medium:
- state government records
- Type:
- Text
- Format:
- application/pdf
- Description:
- Began with: August 28, 2013.
Effective March 12, 2014, name of issuing body appears as Southern Regional Field Office.
August 28, 2013; title from caption (Georgia Government Publications database, viewed January 19, 2018).
January 17, 2018 (received via e-mail on January 18, 2018 from Georgia Department of Agriculture); (Georgia Government Publications database, viewed November 22, 2017). - External Identifiers:
- Call Number GA A400.C7 P1 H2 2012/8-29
- Metadata URL:
- https://dlg.galileo.usg.edu/id:dlg_ggpd_i-ga-ba400-pc7-bp1-bh2-b2012-s8-h29-belec-p-btext
- Digital Object URL:
- https://dlg.galileo.usg.edu/do:dlg_ggpd_i-ga-ba400-pc7-bp1-bh2-b2012-s8-h29-belec-p-btext
- Language:
- eng
- Holding Institution:
- University of Georgia. Map and Government Information Library
- Rights:
-

United States Department of Agriculture National Agricultural Statistics Service
GA Broiler Hatchery News Release
In Cooperation with the Georgia Department of Agriculture Georgia Field Office 355 East Hancock Avenue, Suite 320 Athens, GA 30601 (706) 546-2236
www.nass.usda.gov
August 29, 2012
Media Contact: Douglas G. Kleweno nass-ga@nass.usda.gov
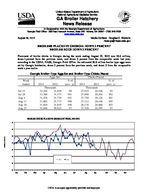
BROILERS PLACED IN GEORGIA DOWN 3 PERCENT BROILER EGGS DOWN 3 PERCENT
Placement of broiler chicks in Georgia during the week ending August 25, 2012 was 26.6 million, down 1 percent from the previous week, and down 3 percent from the comparable week last year, according to the USDA, NASS, Georgia Field Office. An estimated 30.8 million broiler type eggs were set by Georgia hatcheries, down 3 percent from the previous week, and down 3 from the comparable week a year earlier.
Georgia Broiler-Type Eggs Set and Broiler-Type Chicks Placed
Eggs Set
Chicks Placed
Week
% of
% of
Ended
2011
2012
prev. yr. 2011
2012
prev. yr.
Thousands
Thousands
Jul 21
32,256 31,849
99
27,925 26,546
95
Jul 28
31,388 31,573 101
27,696 28,246 102
Aug 4
31,538 31,739 101
27,750 28,124 101
Aug 11
31,682 31,773 100
27,112 28,416 105
Aug 18
31,810 31,810 100
26,176 26,860 103
Aug 25
31,646 30,825
97
27,358 26,597
97
BROILER CHICKS PLACED IN GEORGIA BY WEEK, 2011-2012
30
29
28
27
26
25
2011
2012
24
23
Jan
Feb
Mar
Apr
May
Jun
Jul
Aug
Sep
Oct
Nov
Dec
Million Chicks
USDA is an equal opportunity provider and employer.
Broiler-Type Eggs Set 19 Selected States: 2012
State
Alabama .............................................. Arkansas ............................................. Delaware ............................................. Florida ................................................. Georgia ................................................ Kentucky .............................................. Louisiana ............................................. Maryland .............................................. Mississippi ........................................... Missouri ...............................................
July 21, 2012
(1,000 eggs)
27,947 19,931
3,503 1,341 31,849 7,742 3,107 7,220 17,795 8,024
North Carolina ..................................... Oklahoma ............................................ Pennsylvania ....................................... South Carolina ..................................... Texas ................................................... Virginia ................................................ California, Tennessee,
and West Virginia ..............................
19,628 6,689 3,535 5,319
14,500 6,217
10,722
19 State total .......................................
195,069
Previous year total ...............................
195,141
Percent of previous year .....................
100
July 28, 2012
(1,000 eggs)
28,141 20,915
3,501 1,352 31,573 7,728 3,167 7,600 17,838 7,835
19,638 6,714 3,570 5,603
14,254 6,182
10,683
196,294
194,434
101
Week ending
August 4, 2012
August 11, 2012
(1,000 eggs)
(1,000 eggs)
27,360 21,130
3,497 1,353 31,739 7,631 3,165 7,595 17,667 7,863
27,996 21,057
3,279 1,352 31,773 7,673 3,211 7,254 17,075 8,036
19,600 6,476 3,538 5,313
14,394 6,089
19,222 6,276 3,398 5,328
13,789 6,074
10,763
10,460
195,173
193,253
195,036
194,164
100
100
August 18, 2012
(1,000 eggs)
27,551 20,944
3,176 1,353 31,810 7,639 3,135 7,341 16,782 8,022
19,474 6,891 3,655 5,040
13,066 6,043
10,029
191,951
193,090
99
August 25, 2012
(1,000 eggs)
27,927 20,651
3,286 1,349 30,825 7,641 3,167 7,346 16,226 8,032
19,688 6,686 3,625 5,265
13,491 6,049
10,490
191,744
193,007
99
Broiler-Type Chicks Placed 19 Selected States: 2012
State
Alabama .............................................. Arkansas ............................................. Delaware ............................................. Florida ................................................. Georgia ................................................ Kentucky .............................................. Louisiana ............................................. Maryland .............................................. Mississippi ........................................... Missouri ...............................................
July 21, 2012
(1,000 chicks)
20,517 20,502
4,250 1,179 26,546 6,142 3,098 7,131 15,216 4,708
July 28, 2012
(1,000 chicks)
19,417 19,313
3,153 1,211 28,246 5,925 2,935 6,093 14,933 5,159
Week ending
August 4, 2012
August 11, 2012
(1,000 chicks) (1,000 chicks)
19,749 17,406
3,361 1,138 28,124 6,483 3,067 6,452 15,326 6,071
19,688 18,903
4,085 1,010 28,416 6,683 2,794 6,135 15,357 5,711
August 18, 2012
(1,000 chicks)
19,877 19,160
4,394 1,304 26,860 5,893 2,796 6,483 15,261 5,029
August 25, 2012
(1,000 chicks)
20,089 19,431
4,577 1,248 26,597 6,196 2,836 4,842 15,207 5,723
North Carolina ..................................... Oklahoma ............................................ Pennsylvania ....................................... South Carolina ..................................... Texas ................................................... Virginia ................................................ California, Tennessee,
and West Virginia ..............................
16,227 4,335 2,962 4,142
11,930 4,312
10,696
15,898 4,151 2,986 4,273
11,905 5,383
10,201
16,407 4,914 3,157 4,033
12,169 5,327
10,544
15,503 3,896 2,911 4,049
12,224 5,224
9,913
15,323 4,892 2,901 4,453
12,010 4,721
11,084
15,684 4,163 2,979 4,587
11,882 4,918
10,859
19 State total .......................................
163,893
161,182
163,728
162,502
162,441
161,818
Previous year total ...............................
162,828
162,898
164,050
162,336
161,039
162,943
Percent of previous year .....................
101
99
100
100
101
99
Average hatchability for chicks hatched in the 19 selected States during the week was 85 percent. Average hatchability is calculated by dividing chicks hatched during the week by eggs set three weeks earlier.