- Collection:
- Georgia Government Publications
- Serial:
- Broiler hatchery news release / United States Department of Agriculture National Agricultural Statistics Service.
- Title:
- Georgia broiler hatchery news release, 2012 August 15
- Creator:
- Georgia Crop Reporting Service
- Contributor to Resource:
- United States. National Agricultural Statistics Service. Southern Regional Field Office, issuing body.
Alabama. Department of Agriculture and Industries, issuing body.
Florida. Department of Agriculture and Consumer Services, issuing body.
Georgia. Department of Agriculture, issuing body.
South Carolina. Department of Agriculture, issuing body. - Publisher:
- Athens, Ga. : Georgia Agricultural Statistics Service
- Date of Original:
- 2012-08-15
- Subject:
- Poultry--Hatcheries--Georgia--Statistics
Eggs--Production--Georgia--Statistics - Location:
- United States, Georgia, 32.75042, -83.50018
- Medium:
- state government records
- Type:
- Text
- Format:
- application/pdf
- Description:
- Began with: August 28, 2013.
Effective March 12, 2014, name of issuing body appears as Southern Regional Field Office.
August 28, 2013; title from caption (Georgia Government Publications database, viewed January 19, 2018).
January 17, 2018 (received via e-mail on January 18, 2018 from Georgia Department of Agriculture); (Georgia Government Publications database, viewed November 22, 2017). - External Identifiers:
- Call Number GA A400.C7 P1 H2 2012/8-15
- Metadata URL:
- https://dlg.galileo.usg.edu/id:dlg_ggpd_i-ga-ba400-pc7-bp1-bh2-b2012-s8-h15-belec-p-btext
- Digital Object URL:
- https://dlg.galileo.usg.edu/do:dlg_ggpd_i-ga-ba400-pc7-bp1-bh2-b2012-s8-h15-belec-p-btext
- Language:
- eng
- Holding Institution:
- University of Georgia. Map and Government Information Library
- Rights:
-

United States Department of Agriculture National Agricultural Statistics Service
GA Broiler Hatchery News Release
In Cooperation with the Georgia Department of Agriculture Georgia Field Office 355 East Hancock Avenue, Suite 320 Athens, GA 30601 (706) 546-2236
www.nass.usda.gov
August 15, 2012
Media Contact: Douglas G. Kleweno nass-ga@nass.usda.gov
BROILERS PLACED IN GEORGIA UP 5 PERCENT BROILER EGGS SET UP SLIGHTLY
Placement of broiler chicks in Georgia during the week ending August 11, 2012 was 28.4 million, up 1 percent from the previous week, and up 5 percent from the comparable week last year, according to the USDA, NASS, Georgia Field Office. An estimated 31.7 million broiler type eggs were set by Georgia hatcheries, down slightly from the previous week, and up slightly from the comparable week a year earlier.
Georgia Broiler-Type Eggs Set and Broiler-Type Chicks Placed
Eggs Set
Chicks Placed
Week
% of
% of
Ended
2011
2012
prev. yr. 2011
2012
prev. yr.
Thousands
Thousands
Jul 7
32,505 32,496 100
28,696 26,599
93
Jul 14
32,177 32,461 101
27,282 26,917
99
Jul 21
32,256 31,849
99
27,925 26,546
95
Jul 28
31,388 31,573 101
27,696 28,246 102
Aug 4
31,538 31,739 101
27,750 28,124 101
Aug 11
31,682 31,738 100
27,112 28,437 105
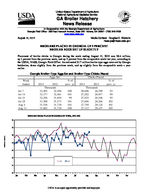
BROILER CHICKS PLACED IN GEORGIA BY WEEK, 2011-2012
30
29
28
27
26
25
2011
2012
24
23
Jan
Feb
Mar
Apr
May
Jun
Jul
Aug
Sep
Oct
Nov
Dec
Million Chicks
USDA is an equal opportunity provider and employer.
Broiler-Type Eggs Set 19 Selected States: 2012
State
Alabama .............................................. Arkansas ............................................. Delaware ............................................. Florida ................................................. Georgia ................................................ Kentucky .............................................. Louisiana ............................................. Maryland .............................................. Mississippi ........................................... Missouri ...............................................
July 7, 2012
(1,000 eggs)
27,313 20,278
3,371 1,353 32,496 7,452 3,258 7,045 17,655 7,388
North Carolina ..................................... Oklahoma ............................................ Pennsylvania ....................................... South Carolina ..................................... Texas ................................................... Virginia ................................................ California, Tennessee,
and West Virginia ..............................
19,825 6,798 3,616 5,306
14,138 5,854
10,619
19 State total .......................................
193,765
Previous year total ...............................
194,961
Percent of previous year .....................
99
July 14, 2012
(1,000 eggs)
27,908 19,621
3,295 1,352 32,461 7,659 3,409 7,351 18,063 8,068
19,816 6,465 3,767 5,298
14,612 6,222
10,744
196,111
196,576
100
Week ending
July 21, 2012
July 28, 2012
(1,000 eggs)
(1,000 eggs)
27,947 19,931
3,503 1,341 31,849 7,790 3,107 7,220 17,795 8,024
28,149 20,915
3,501 1,352 31,573 7,811 3,167 7,600 17,838 7,835
19,628 6,689 3,535 5,319
14,500 6,217
19,638 6,714 3,570 5,603
14,254 6,182
10,722
10,683
195,117
196,385
195,141
194,434
100
101
August 4, 2012
(1,000 eggs)
27,656 21,130
3,497 1,353 31,739 7,659 3,227 7,595 17,667 7,863
19,510 6,476 3,441 5,313
14,394 6,089
10,763
195,372
195,036
100
August 11, 2012
(1,000 eggs)
27,996 21,057
3,279 1,352 31,738 7,673 3,211 7,254 17,192 8,036
19,222 6,276 3,487 5,328
13,789 6,074
10,460
193,424
194,164
100
Broiler-Type Chicks Placed 19 Selected States: 2012
State
Alabama .............................................. Arkansas ............................................. Delaware ............................................. Florida ................................................. Georgia ................................................ Kentucky .............................................. Louisiana ............................................. Maryland .............................................. Mississippi ........................................... Missouri ...............................................
July 7, 2012
(1,000 chicks)
19,941 20,381
4,720 1,234 26,599 5,906 2,913 5,716 14,915 5,111
July 14, 2012
(1,000 chicks)
20,301 19,209
4,989 1,168 26,917 5,873 2,961 5,582 15,485 5,064
Week ending
July 21, 2012
July 28, 2012
(1,000 chicks) (1,000 chicks)
20,517 20,502
4,250 1,179 26,546 6,142 3,098 7,131 15,216 4,708
19,417 19,313
3,153 1,211 28,246 5,925 2,935 6,093 14,933 5,159
August 4, 2012
(1,000 chicks)
19,749 17,406
3,361 1,138 28,124 6,483 3,067 6,452 15,326 6,071
August 11, 2012
(1,000 chicks)
19,683 18,903
4,085 1,010 28,437 6,447 2,794 6,135 15,360 5,711
North Carolina ..................................... Oklahoma ............................................ Pennsylvania ....................................... South Carolina ..................................... Texas ................................................... Virginia ................................................ California, Tennessee,
and West Virginia ..............................
15,844 4,248 3,020 4,831
12,127 4,294
11,859
15,714 4,343 3,003 4,524
12,156 4,712
11,203
16,227 4,335 2,962 4,142
11,930 4,312
10,696
15,898 4,151 2,986 4,273
11,905 5,383
10,201
16,407 4,914 3,157 4,033
12,169 5,327
10,544
15,496 3,896 2,891 4,049
12,224 5,224
10,258
19 State total .......................................
163,659
163,204
163,893
161,182
163,728
162,603
Previous year total ...............................
165,957
164,445
162,828
162,898
164,050
162,336
Percent of previous year .....................
99
99
101
99
100
100
Average hatchability for chicks hatched in the 19 selected States during the week was 85 percent. Average hatchability is calculated by dividing chicks hatched during the week by eggs set three weeks earlier.