- Collection:
- Georgia Government Publications
- Serial:
- Broiler hatchery news release / United States Department of Agriculture National Agricultural Statistics Service.
- Title:
- Georgia broiler hatchery news release, 2012 July 18
- Creator:
- Georgia Crop Reporting Service
- Contributor to Resource:
- United States. National Agricultural Statistics Service. Southern Regional Field Office, issuing body.
Alabama. Department of Agriculture and Industries, issuing body.
Florida. Department of Agriculture and Consumer Services, issuing body.
Georgia. Department of Agriculture, issuing body.
South Carolina. Department of Agriculture, issuing body. - Publisher:
- Athens, Ga. : Georgia Agricultural Statistics Service
- Date of Original:
- 2012-07-18
- Subject:
- Poultry--Hatcheries--Georgia--Statistics
Eggs--Production--Georgia--Statistics - Location:
- United States, Georgia, 32.75042, -83.50018
- Medium:
- state government records
- Type:
- Text
- Format:
- application/pdf
- Description:
- Began with: August 28, 2013.
Effective March 12, 2014, name of issuing body appears as Southern Regional Field Office.
August 28, 2013; title from caption (Georgia Government Publications database, viewed January 19, 2018).
January 17, 2018 (received via e-mail on January 18, 2018 from Georgia Department of Agriculture); (Georgia Government Publications database, viewed November 22, 2017). - External Identifiers:
- Call Number GA A400.C7 P1 H2 2012/7-18
- Metadata URL:
- https://dlg.galileo.usg.edu/id:dlg_ggpd_i-ga-ba400-pc7-bp1-bh2-b2012-s7-h18-belec-p-btext
- Digital Object URL:
- https://dlg.galileo.usg.edu/do:dlg_ggpd_i-ga-ba400-pc7-bp1-bh2-b2012-s7-h18-belec-p-btext
- Language:
- eng
- Holding Institution:
- University of Georgia. Map and Government Information Library
- Rights:
-

United States Department of Agriculture National Agricultural Statistics Service
GA Broiler Hatchery News Release
In Cooperation with the Georgia Department of Agriculture Georgia Field Office 355 East Hancock Avenue, Suite 320 Athens, GA 30601 (706) 546-2236
www.nass.usda.gov
July 18, 2012
Media Contact: Douglas G. Kleweno nass-ga@nass.usda.gov
BROILERS PLACED IN GEORGIA DOWN 2 PERCENT BROILER EGGS SET UP 1 PERCENT
Placement of broiler chicks in Georgia during the week ending July 14, 2012 was 26.8 million, up 1 percent from the previous week, but down 2 percent from the comparable week last year, according to the USDA, NASS, Georgia Field Office. An estimated 32.5 million broiler type eggs were set by Georgia hatcheries, down slightly from the previous week, but up 1 percent from the comparable week a year earlier.
Georgia Broiler-Type Eggs Set and Broiler-Type Chicks Placed
Eggs Set
Chicks Placed
Week
% of
% of
Ended
2011
2012 prev. yr. 2011
2012 prev. yr.
Thousands
Thousands
Jun 9
33,547 32,466 97
28,436 27,682 97
Jun 16
32,798 32,496 99
28,732 28,166 98
Jun 23
32,225 31,982 99
28,027 28,025 100
Jun 30
32,833 31,697 97
27,665 27,187 98
Jul 7
32,505 32,539 100
28,696 26,575 93
Jul 14
32,177 32,471 101
27,282 26,809 98
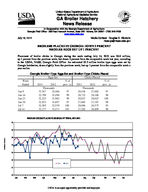
BROILER CHICKS PLACED IN GEORGIA BY WEEK, 2011-2012
30
29
28
27
26
25 2011 2012
24
23
Jan
Feb
Mar
Apr
May
Jun
Jul
Aug
Sep
Oct
Nov
Dec
Million Chicks
USDA is an equal opportunity provider and employer.
Broiler-Type Eggs Set 19 Selected States: 2012
State
Alabama .............................................. Arkansas ............................................. Delaware ............................................. Florida ................................................. Georgia ................................................ Kentucky .............................................. Louisiana ............................................. Maryland .............................................. Mississippi ........................................... Missouri ...............................................
June 9, 2012
(1,000 eggs)
28,292 21,703
3,547 1,350 32,466 7,714 3,439 7,194 18,181 8,023
North Carolina ..................................... Oklahoma ............................................ Pennsylvania ....................................... South Carolina ..................................... Texas ................................................... Virginia ................................................ California, Tennessee,
and West Virginia ..............................
19,844 7,024 3,789 5,558
14,801 6,325
10,614
19 State total .......................................
199,864
Previous year total ...............................
204,659
Percent of previous year .....................
98
June 16, 2012
(1,000 eggs)
27,724 21,421
3,519 1,351 32,496 7,744 3,254 7,483 17,404 7,635
19,509 6,600 3,781 5,066
14,533 6,252
10,764
196,536
199,826
98
Week ending
June 23, 2012
June 30, 2012
(1,000 eggs)
(1,000 eggs)
28,068 20,870
3,557 1,353 31,982 6,960 3,303 7,456 17,938 7,196
27,846 20,976
3,570 1,352 31,697 7,418 3,440 7,401 17,823 7,774
19,662 6,473 3,651 5,299
14,546 6,219
19,559 6,550 3,600 5,559
14,253 6,340
10,974
11,118
195,507
196,276
198,340
197,158
99
100
July 7, 2012
(1,000 eggs)
27,265 20,387
3,371 1,353 32,539 7,450 3,134 7,045 17,504 7,388
19,825 6,798 3,616 5,306
14,139 6,101
10,715
193,936
194,961
99
July 14, 2012
(1,000 eggs)
27,946 19,742
3,295 1,352 32,471 7,743 3,409 7,351 18,063 8,068
19,816 6,465 3,731 5,298
14,587 5,919
10,601
195,857
196,576
100
Broiler-Type Chicks Placed 19 Selected States: 2012
State
Alabama .............................................. Arkansas ............................................. Delaware ............................................. Florida ................................................. Georgia ................................................ Kentucky .............................................. Louisiana ............................................. Maryland .............................................. Mississippi ........................................... Missouri ...............................................
June 9, 2012
(1,000 chicks)
20,717 20,656
4,333 1,175 27,682 6,213 3,077 5,864 15,208 5,408
June 16, 2012
(1,000 chicks)
20,257 20,394
4,764 1,261 28,166 6,571 3,240 5,801 15,594 6,084
Week ending
June 23, 2012
June 30, 2012
(1,000 chicks) (1,000 chicks)
20,419 19,950
5,003 1,058 28,025 6,269 3,327 6,164 15,432 5,727
20,806 19,778
3,787 1,079 27,187 6,536 3,066 6,947 15,520 5,952
July 7, 2012
(1,000 chicks)
19,941 20,381
4,720 1,234 26,575 5,929 2,913 5,716 14,915 5,111
July 14, 2012
(1,000 chicks)
20,304 19,209
4,989 1,168 26,809 5,604 2,961 5,582 15,487 5,064
North Carolina ..................................... Oklahoma ............................................ Pennsylvania ....................................... South Carolina ..................................... Texas ................................................... Virginia ................................................ California, Tennessee,
and West Virginia ..............................
16,345 4,430 3,023 4,937
12,093 5,264
10,899
16,154 3,636 3,054 4,676
12,331 4,922
10,540
16,322 4,749 3,092 4,803
12,155 4,526
10,735
15,485 4,776 3,014 5,077
12,312 4,900
9,519
15,844 4,248 3,020 4,831
12,129 4,294
11,849
15,714 4,343 3,028 4,524
12,155 4,712
11,189
19 State total .......................................
167,324
167,445
167,756
165,741
163,650
162,842
Previous year total ...............................
169,855
168,765
168,554
168,718
165,957
164,445
Percent of previous year .....................
99
99
100
98
99
99
Average hatchability for chicks hatched in the 19 selected States during the week was 85 percent. Average hatchability is calculated by dividing chicks hatched during the week by eggs set three weeks earlier.