- Collection:
- Georgia Government Publications
- Serial:
- Broiler hatchery news release / United States Department of Agriculture National Agricultural Statistics Service.
- Title:
- Georgia broiler hatchery news release, 2012 June 6
- Creator:
- Georgia Crop Reporting Service
- Contributor to Resource:
- United States. National Agricultural Statistics Service. Southern Regional Field Office, issuing body.
Alabama. Department of Agriculture and Industries, issuing body.
Florida. Department of Agriculture and Consumer Services, issuing body.
Georgia. Department of Agriculture, issuing body.
South Carolina. Department of Agriculture, issuing body. - Publisher:
- Athens, Ga. : Georgia Agricultural Statistics Service
- Date of Original:
- 2012-06-06
- Subject:
- Poultry--Hatcheries--Georgia--Statistics
Eggs--Production--Georgia--Statistics - Location:
- United States, Georgia, 32.75042, -83.50018
- Medium:
- state government records
- Type:
- Text
- Format:
- application/pdf
- Description:
- Began with: August 28, 2013.
Effective March 12, 2014, name of issuing body appears as Southern Regional Field Office.
August 28, 2013; title from caption (Georgia Government Publications database, viewed January 19, 2018).
January 17, 2018 (received via e-mail on January 18, 2018 from Georgia Department of Agriculture); (Georgia Government Publications database, viewed November 22, 2017). - External Identifiers:
- Call Number GA A400.C7 P1 H2 2012/6-6
- Metadata URL:
- https://dlg.galileo.usg.edu/id:dlg_ggpd_i-ga-ba400-pc7-bp1-bh2-b2012-s6-h6-belec-p-btext
- Digital Object URL:
- https://dlg.galileo.usg.edu/do:dlg_ggpd_i-ga-ba400-pc7-bp1-bh2-b2012-s6-h6-belec-p-btext
- Language:
- eng
- Holding Institution:
- University of Georgia. Map and Government Information Library
- Rights:
-

United States Department of Agriculture National Agricultural Statistics Service
GA Broiler Hatchery News Release
In Cooperation with the Georgia Department of Agriculture Georgia Field Office 355 East Hancock Avenue, Suite 320 Athens, GA 30601 (706) 546-2236
www.nass.usda.gov
June 6, 2012
Media Contact: Douglas G. Kleweno nass-ga@nass.usda.gov
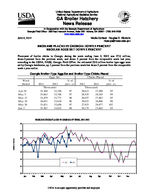
BROILERS PLACED IN GEORGIA DOWN 5 PERCENT BROILER EGGS SET DOWN 2 PERCENT
Placement of broiler chicks in Georgia during the week ending June 2, 2012 was 27.6 million, down 3 percent from the previous week, and down 5 percent from the comparable week last year, according to the USDA, NASS, Georgia Field Office. An estimated 33.0 million broiler type eggs were set by Georgia hatcheries, up 1 percent from the previous week but down 2 percent from the comparable week a year earlier.
Georgia Broiler-Type Eggs Set and Broiler-Type Chicks Placed
Eggs Set
Chicks Placed
Week
% of
% of
Ended
2011
2012
prev. yr. 2011
2012
prev. yr.
Thous ands
Thous ands
Apr 28
33,368 32,356
97
28,613 27,300
95
May 5
33,663 32,768
97
28,535 28,245
99
May 12
33,479 32,771
98
28,937 27,482
95
May 19
34,021 32,634
96
29,633 26,806
90
May 26
33,821 32,656
97
27,923 28,477 102
Jun 2
33,567 33,032
98
29,175 27,602
95
Million Chicks
BROILER CHICKS PLACED IN GEORGIA BY WEEK, 2011-2012
30
29
28
27
26
25 2011 2012
24
23
Jan
Feb
Mar
Apr
May
Jun
Jul
Aug
Sep
Oct
Nov
Dec
USDA is an equal opportunity provider and employer.
Broiler-Type Eggs Set 19 Selected States: 2012
State
Alabama ............................................. Arkansas ............................................ Delaware ............................................ Florida ................................................ Georgia .............................................. Kentucky ............................................. Louisiana ............................................ Maryland ............................................. Mississippi .......................................... Missouri ..............................................
April 28, 2012
(1,000 eggs)
28,238 21,246
3,470 1,353 32,356 7,421 3,440 7,628 17,404 7,473
North Carolina .................................... Oklahoma ........................................... Pennsylvania ...................................... South Carolina .................................... Texas ................................................. Virginia ............................................... California, Tennessee,
and West Virginia ..............................
20,139 6,970 3,597 5,437
14,551 6,294
11,145
19 State total ......................................
198,162
Previous year total ..............................
207,087
Percent of previous year .....................
96
May 5, 2012
(1,000 eggs)
28,305 21,684
3,620 1,352 32,768 7,750 3,485 7,449 18,003 7,481
20,583 6,712 3,610 5,376
14,696 6,290
10,718
199,882
207,982
96
Week ending
May 12, 2012
May 19, 2012
(1,000 eggs)
(1,000 eggs)
27,976 21,793
3,622 1,353 32,771 7,853 3,470 7,087 18,185 7,687
28,384 21,765
3,696 1,353 32,634 7,735 3,455 7,200 17,810 7,726
20,044 6,926 3,636 5,481
14,627 6,281
20,426 6,843 3,650 5,462
14,769 6,279
10,901
11,115
199,693
200,302
206,342
206,792
97
97
May 26, 2012
(1,000 eggs)
28,329 21,401
3,699 1,353 32,656 7,731 3,409 7,388 18,078 7,788
20,126 7,133 3,838 5,277
15,061 6,353
11,244
200,864
205,932
98
June 2, 2012
(1,000 eggs)
28,305 21,578
3,710 1,352 33,032 7,728 3,500 7,672 18,065 7,788
19,992 6,801 3,719 5,091
14,967 6,425
10,739
200,464
205,234
98
Broiler-Type Chicks Placed 19 Selected States: 2012
State
Alabama ............................................. Arkansas ............................................ Delaware ............................................ Florida ................................................ Georgia .............................................. Kentucky ............................................. Louisiana ............................................ Maryland ............................................. Mississippi .......................................... Missouri ..............................................
April 28, 2012
(1,000 chicks)
20,201 19,093
4,190 1,250 27,300 6,453 3,084 6,677 15,353 5,924
May 5, 2012
(1,000 chicks)
20,231 18,848
4,350 1,083 28,245 6,119 3,124 6,380 14,874 5,767
Week ending
May 12, 2012
May 19, 2012
(1,000 chicks) (1,000 chicks)
19,775 20,132
3,956 1,328 27,482 6,666 3,130 6,860 15,477 5,113
20,746 19,908
4,361 1,509 26,806 5,876 3,075 6,377 15,042 5,491
May 26, 2012
(1,000 chicks)
20,482 20,303
3,733 1,333 28,477 6,768 3,111 6,367 15,401 5,384
June 2, 2012
(1,000 chicks)
20,117 20,800
4,235 1,285 27,602 6,305 3,084 6,528 15,686 5,186
North Carolina .................................... Oklahoma ........................................... Pennsylvania ...................................... South Carolina .................................... Texas ................................................. Virginia ............................................... California, Tennessee,
and West Virginia ..............................
16,189 4,887 3,101 5,350
12,424 4,906
10,290
16,434 5,067 3,138 4,520
12,242 4,604
11,207
16,649 4,573 3,151 4,819
12,343 4,935
10,680
16,278 4,237 2,954 3,779
12,106 5,187
11,626
16,817 4,156 2,993 3,766
12,338 5,009
10,561
16,294 4,315 3,044 4,623
12,165 5,021
10,290
19 State total ......................................
166,672
166,233
167,069
165,358
166,999
166,580
Previous year total ..............................
172,624
172,506
174,014
172,512
172,753
171,318
Percent of previous year .....................
97
96
96
96
97
97
Average hatchability for chicks hatched in the 19 selected States during the week was 85 percent. Average hatchability is calculated by dividing chicks hatched during the week by eggs set three weeks earlier.