- Collection:
- Georgia Government Publications
- Serial:
- Broiler hatchery news release / United States Department of Agriculture National Agricultural Statistics Service.
- Title:
- Georgia broiler hatchery news release, 2012 June 27
- Creator:
- Georgia Crop Reporting Service
- Contributor to Resource:
- United States. National Agricultural Statistics Service. Southern Regional Field Office, issuing body.
Alabama. Department of Agriculture and Industries, issuing body.
Florida. Department of Agriculture and Consumer Services, issuing body.
Georgia. Department of Agriculture, issuing body.
South Carolina. Department of Agriculture, issuing body. - Publisher:
- Athens, Ga. : Georgia Agricultural Statistics Service
- Date of Original:
- 2012-06-27
- Subject:
- Poultry--Hatcheries--Georgia--Statistics
Eggs--Production--Georgia--Statistics - Location:
- United States, Georgia, 32.75042, -83.50018
- Medium:
- state government records
- Type:
- Text
- Format:
- application/pdf
- Description:
- Began with: August 28, 2013.
Effective March 12, 2014, name of issuing body appears as Southern Regional Field Office.
August 28, 2013; title from caption (Georgia Government Publications database, viewed January 19, 2018).
January 17, 2018 (received via e-mail on January 18, 2018 from Georgia Department of Agriculture); (Georgia Government Publications database, viewed November 22, 2017). - External Identifiers:
- Call Number GA A400.C7 P1 H2 2012/6-27
- Metadata URL:
- https://dlg.galileo.usg.edu/id:dlg_ggpd_i-ga-ba400-pc7-bp1-bh2-b2012-s6-h27-belec-p-btext
- Digital Object URL:
- https://dlg.galileo.usg.edu/do:dlg_ggpd_i-ga-ba400-pc7-bp1-bh2-b2012-s6-h27-belec-p-btext
- Language:
- eng
- Holding Institution:
- University of Georgia. Map and Government Information Library
- Rights:
-

United States Department of Agriculture National Agricultural Statistics Service
GA Broiler Hatchery News Release
In Cooperation with the Georgia Department of Agriculture Georgia Field Office 355 East Hancock Avenue, Suite 320 Athens, GA 30601 (706) 546-2236
www.nass.usda.gov
June 27, 2012
Media Contact: Douglas G. Kleweno nass-ga@nass.usda.gov
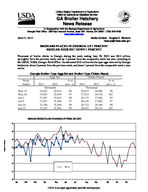
BROILERS PLACED IN GEORGIA UP 1 PERCENT BROILER EGGS SET DOWN 1 PERCENT
Placement of broiler chicks in Georgia during the week ending June 23, 2012 was 28.2 million, up slightly from the previous week, and up 1 percent from the comparable week last year, according to the USDA, NASS, Georgia Field Office. An estimated 32.0 million broiler type eggs were set by Georgia hatcheries, down 2 percent from the previous week, and down 1 percent from the comparable week a year earlier.
Georgia Broiler-Type Eggs Set and Broiler-Type Chicks Placed
Eggs Set
Chicks Placed
Week
% of
% of
Ended
2011
2012
prev. yr. 2011
2012
prev. yr.
Thousands
Thousands
May 19
34,021 32,634
96
29,633 26,806
90
May 26
33,821 32,656
97
27,923 28,532 102
Jun 2
33,567 33,032
98
29,175 27,656
95
Jun 9
33,547 32,466
97
28,436 27,682
97
Jun 16
32,798 32,496
99
28,732 28,166
98
Jun 23
32,225 31,982
99
28,027 28,213 101
Million Chicks
BROILER CHICKS PLACED IN GEORGIA BY WEEK, 2011-2012
30
29
28
27
26
25 2011 2012
24
23
Jan
Feb
Mar
Apr
May
Jun
Jul
Aug
Sep
Oct
Nov
Dec
USDA is an equal opportunity provider and employer.
Broiler-Type Eggs Set 19 Selected States: 2012
State
Alabama .............................................. Arkansas ............................................. Delaware ............................................. Florida ................................................. Georgia ................................................ Kentucky .............................................. Louisiana ............................................. Maryland .............................................. Mississippi ........................................... Missouri ...............................................
May 19, 2012
(1,000 eggs)
28,424 21,826
3,696 1,353 32,634 7,871 3,455 7,200 18,095 7,726
North Carolina ..................................... Oklahoma ............................................ Pennsylvania ....................................... South Carolina ..................................... Texas ................................................... Virginia ................................................ California, Tennessee,
and West Virginia ..............................
20,428 6,843 3,710 5,462
14,589 6,279
11,129
19 State total .......................................
200,720
Previous year total ...............................
206,792
Percent of previous year .....................
97
May 26, 2012
(1,000 eggs)
28,321 21,553
3,699 1,353 32,656 7,893 3,409 7,388 18,078 7,989
19,953 7,133 3,838 5,277
15,070 6,353
11,060
201,023
205,932
98
Week ending
June 2, 2012
June 9, 2012
(1,000 eggs)
(1,000 eggs)
28,329 21,790
3,710 1,352 33,032 7,759 3,500 7,672 18,065 7,988
28,277 21,492
3,547 1,350 32,466 7,647 3,439 7,194 18,000 8,023
20,166 6,801 3,840 5,091
15,039 6,425
19,843 7,024 3,789 5,558
14,790 6,325
10,756
10,589
201,315
199,353
205,234
204,659
98
97
June 16, 2012
(1,000 eggs)
27,872 21,354
3,519 1,351 32,496 7,676 3,409 7,483 17,404 7,635
19,508 6,600 3,781 5,066
14,550 6,252
10,736
196,692
199,826
98
June 23, 2012
(1,000 eggs)
27,279 20,870
3,557 1,353 31,982 7,434 3,303 7,456 17,938 7,196
19,494 6,473 3,685 5,299
14,563 6,219
10,860
194,961
198,340
98
Broiler-Type Chicks Placed 19 Selected States: 2012
State
Alabama .............................................. Arkansas ............................................. Delaware ............................................. Florida ................................................. Georgia ................................................ Kentucky .............................................. Louisiana ............................................. Maryland .............................................. Mississippi ........................................... Missouri ...............................................
May 19, 2012
(1,000 chicks)
20,746 19,908
4,361 1,509 26,806 5,950 3,075 6,377 15,042 5,494
May 26, 2012
(1,000 chicks)
20,482 20,303
3,733 1,333 28,532 6,768 3,111 6,367 15,401 5,387
Week ending
June 2, 2012
June 9, 2012
(1,000 chicks) (1,000 chicks)
20,128 20,800
4,235 1,285 27,656 6,305 3,084 6,528 15,672 5,186
20,717 20,656
4,333 1,175 27,682 6,213 3,077 5,864 15,208 5,408
June 16, 2012
(1,000 chicks)
20,257 20,394
4,764 1,260 28,166 6,571 3,240 5,801 15,594 6,084
June 23, 2012
(1,000 chicks)
20,364 19,950
5,003 1,058 28,213 6,378 3,327 6,164 15,435 5,727
North Carolina ..................................... Oklahoma ............................................ Pennsylvania ....................................... South Carolina ..................................... Texas ................................................... Virginia ................................................ California, Tennessee,
and West Virginia ..............................
16,338 4,237 2,954 3,779
12,113 5,187
11,676
16,820 4,156 2,993 3,766
12,345 5,009
10,618
16,227 4,315 3,007 4,623
12,171 5,021
10,341
16,345 4,430 3,023 4,937
12,083 5,264
10,856
16,154 3,636 3,054 4,676
12,325 4,922
10,514
16,308 4,749 3,177 4,803
12,145 4,526
10,502
19 State total .......................................
165,552
167,124
166,584
167,271
167,412
167,829
Previous year total ...............................
172,512
172,753
171,318
169,855
168,765
168,554
Percent of previous year .....................
96
97
97
98
99
100
Average hatchability for chicks hatched in the 19 selected States during the week was 85 percent. Average hatchability is calculated by dividing chicks hatched during the week by eggs set three weeks earlier.