- Collection:
- Georgia Government Publications
- Serial:
- Broiler hatchery news release / United States Department of Agriculture National Agricultural Statistics Service.
- Title:
- Georgia broiler hatchery news release, 2012 December 27
- Creator:
- Georgia Crop Reporting Service
- Contributor to Resource:
- United States. National Agricultural Statistics Service. Southern Regional Field Office, issuing body.
Alabama. Department of Agriculture and Industries, issuing body.
Florida. Department of Agriculture and Consumer Services, issuing body.
Georgia. Department of Agriculture, issuing body.
South Carolina. Department of Agriculture, issuing body. - Publisher:
- Athens, Ga. : Georgia Agricultural Statistics Service
- Date of Original:
- 2012-12-27
- Subject:
- Poultry--Hatcheries--Georgia--Statistics
Eggs--Production--Georgia--Statistics - Location:
- United States, Georgia, 32.75042, -83.50018
- Medium:
- state government records
- Type:
- Text
- Format:
- application/pdf
- Description:
- Began with: August 28, 2013.
Effective March 12, 2014, name of issuing body appears as Southern Regional Field Office.
August 28, 2013; title from caption (Georgia Government Publications database, viewed January 19, 2018).
January 17, 2018 (received via e-mail on January 18, 2018 from Georgia Department of Agriculture); (Georgia Government Publications database, viewed November 22, 2017). - External Identifiers:
- Call Number GA A400.C7 P1 H2 2012/12-27
- Metadata URL:
- https://dlg.galileo.usg.edu/id:dlg_ggpd_i-ga-ba400-pc7-bp1-bh2-b2012-s12-h27-belec-p-btext
- Digital Object URL:
- https://dlg.galileo.usg.edu/do:dlg_ggpd_i-ga-ba400-pc7-bp1-bh2-b2012-s12-h27-belec-p-btext
- Language:
- eng
- Holding Institution:
- University of Georgia. Map and Government Information Library
- Rights:
-

United States Department of Agriculture National Agricultural Statistics Service
GA Broiler Hatchery News Release
In Cooperation with the Georgia Department of Agriculture Georgia Field Office 355 East Hancock Avenue, Suite 320 Athens, GA 30601 (706) 546-2236
www.nass.usda.gov
December 27, 2012
Media Contact: Douglas G. Kleweno nass-ga@nass.usda.gov
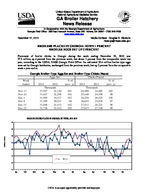
BROILERS PLACED IN GEORGIA DOWN 1 PERCENT BROILER EGGS SET UP 2 PERCENT
Placement of broiler chicks in Georgia during the week ending December 22, 2012 was 27.3 million, up 4 percent from the previous week, but down 1 percent from the comparable week last year, according to the USDA, NASS Georgia Field Office. An estimated 32.4 million broiler type eggs were set by Georgia hatcheries, unchanged from the previous week, but up 2 percent from the comparable week a year earlier.
Georgia Broiler-Type Eggs Set and Broiler-Type Chicks Placed
Eggs Set
Chicks Placed
Week
% of
% of
Ended
2011
2012
prev. yr. 2011
2012
prev. yr.
Thousands
Thousands
Nov 17
31,927 32,130 101
24,488 24,885 102
Nov 24
31,647 32,298 102
25,440 24,958
98
Dec 1
31,993 34,317 107
25,259 26,525 105
Dec 8
31,595 30,251
96
26,653 25,978
97
Dec 15
31,846 32,433 102
27,411 26,221
96
Dec 22
31,736 32,432 102
27,617 27,338
99
BROILER CHICKS PLACED IN GEORGIA BY WEEK, 2011-2012
30
29
28
27
26
25
2011
2012
24
23
Jan
Feb
Mar
Apr
May
Jun
Jul
Aug
Sep
Oct
Nov
Dec
Million Chicks
USDA is an equal opportunity provider and employer.
Broiler-Type Eggs Set 19 Selected States: 2012
State
Alabama .............................................. Arkansas ............................................. Delaware ............................................. Florida ................................................. Georgia ................................................ Kentucky .............................................. Louisiana ............................................. Maryland .............................................. Mississippi ........................................... Missouri ...............................................
November 17, 2012
(1,000 eggs)
27,978 21,588
3,415 1,351 32,130 7,966 3,288 7,158 16,865 8,040
November 24, 2012
(1,000 eggs)
28,045 21,532
3,413 1,353 32,298 7,350 3,258 7,182 17,178 8,013
North Carolina ..................................... Oklahoma ............................................ Pennsylvania ....................................... South Carolina ..................................... Texas ................................................... Virginia ................................................ California, Tennessee,
and West Virginia ..............................
19,640 6,830 3,749 5,397
14,128 6,275
10,830
20,043 6,825 3,701 5,657
14,212 6,455
10,420
19 State total .......................................
196,628
196,935
Previous year total ...............................
195,158
194,560
Percent of previous year .....................
101
101
Week ending
December 1, 2012
December 8, 2012
(1,000 eggs)
(1,000 eggs)
27,975 21,963
3,415 1,655 34,317 7,283 3,258 7,067 17,089 8,012
27,628 20,830
3,414 1,048 30,251 7,696 3,273 7,117 17,377 7,713
December 15, 2012
(1,000 eggs)
27,607 21,845
3,415 1,350 32,433 7,694 3,288 7,185 16,927 7,881
December 22, 2012
(1,000 eggs)
27,736 21,128
3,414 1,353 32,432 7,679 3,304 7,153 16,575 7,897
20,022 7,026 3,935 5,557
14,764 6,638
19,259 6,809 3,583 5,316
13,761 6,002
19,992 6,581 3,812 4,675
14,237 6,476
19,979 6,968 3,729 5,462
14,033 6,490
10,939
9,443
9,694
10,575
200,915
190,520
195,092
195,907
194,178
194,887
194,602
195,380
103
98
100
100
Broiler-Type Chicks Placed 19 Selected States: 2012
State
Alabama .............................................. Arkansas ............................................. Delaware ............................................. Florida ................................................. Georgia ................................................ Kentucky .............................................. Louisiana ............................................. Maryland .............................................. Mississippi ........................................... Missouri ...............................................
November 17, 2012
(1,000 chicks)
19,390 20,306
4,371 1,326 24,885 5,745 2,891 5,307 13,993 5,265
November 24, 2012
(1,000 chicks)
17,883 18,987
4,309 1,162 24,958 5,875 2,664 5,710 12,984 4,869
Week ending
December 1, 2012
December 8, 2012
(1,000 chicks) (1,000 chicks)
19,786 19,476
3,550 1,020 26,525 5,542 2,642 7,060 14,757 5,316
21,156 19,134
3,831 1,369 25,978 6,122 2,940 6,526 14,396 5,768
December 15, 2012
(1,000 chicks)
21,449 20,377
4,086 1,311 26,221 6,315 2,912 6,198 14,770 5,720
December 22, 2012
(1,000 chicks)
21,366 19,661
3,744 1,304 27,338 5,624 2,958 5,513 14,652 5,633
North Carolina ..................................... Oklahoma ............................................ Pennsylvania ....................................... South Carolina ..................................... Texas ................................................... Virginia ................................................ California, Tennessee,
and West Virginia ..............................
15,712 3,680 2,488 4,184
11,256 4,507
10,589
16,127 3,997 2,772 4,885
11,162 3,929
9,465
16,728 4,204 2,804 3,843
11,832 3,592
10,742
15,865 5,307 3,084 5,064
11,940 4,264
10,657
16,416 4,718 2,900 4,344
11,809 4,456
9,602
16,861 5,273 3,283 4,763
12,416 4,973
11,489
19 State total .......................................
155,895
151,738
159,419
163,401
163,604
166,851
Previous year total ...............................
152,567
156,853
160,576
162,541
162,116
162,753
Percent of previous year .....................
102
97
99
101
101
103
Average hatchability for chicks hatched in the 19 selected States during the week was 85 percent. Average hatchability is calculated by dividing chicks hatched during the week by eggs set three weeks earlier.