- Collection:
- Georgia Government Publications
- Serial:
- Broiler hatchery news release / United States Department of Agriculture National Agricultural Statistics Service.
- Title:
- Georgia broiler hatchery news release, 2012 October 31
- Creator:
- Georgia Crop Reporting Service
- Contributor to Resource:
- United States. National Agricultural Statistics Service. Southern Regional Field Office, issuing body.
Alabama. Department of Agriculture and Industries, issuing body.
Florida. Department of Agriculture and Consumer Services, issuing body.
Georgia. Department of Agriculture, issuing body.
South Carolina. Department of Agriculture, issuing body. - Publisher:
- Athens, Ga. : Georgia Agricultural Statistics Service
- Date of Original:
- 2012-10-31
- Subject:
- Poultry--Hatcheries--Georgia--Statistics
Eggs--Production--Georgia--Statistics - Location:
- United States, Georgia, 32.75042, -83.50018
- Medium:
- state government records
- Type:
- Text
- Format:
- application/pdf
- Description:
- Began with: August 28, 2013.
Effective March 12, 2014, name of issuing body appears as Southern Regional Field Office.
August 28, 2013; title from caption (Georgia Government Publications database, viewed January 19, 2018).
January 17, 2018 (received via e-mail on January 18, 2018 from Georgia Department of Agriculture); (Georgia Government Publications database, viewed November 22, 2017). - External Identifiers:
- Call Number GA A400.C7 P1 H2 2012/10-31
- Metadata URL:
- https://dlg.galileo.usg.edu/id:dlg_ggpd_i-ga-ba400-pc7-bp1-bh2-b2012-s10-h31-belec-p-btext
- Digital Object URL:
- https://dlg.galileo.usg.edu/do:dlg_ggpd_i-ga-ba400-pc7-bp1-bh2-b2012-s10-h31-belec-p-btext
- Language:
- eng
- Holding Institution:
- University of Georgia. Map and Government Information Library
- Rights:
-

United States Department of Agriculture National Agricultural Statistics Service
GA Broiler Hatchery News Release
In Cooperation with the Georgia Department of Agriculture Georgia Field Office 355 East Hancock Avenue, Suite 320 Athens, GA 30601 (706) 546-2236
www.nass.usda.gov
October 31, 2012
Media Contact: Douglas G. Kleweno nass-ga@nass.usda.gov
BROILERS PLACED IN GEORGIA UP 5 PERCENT BROILER EGGS SET UP 4 PERCENT
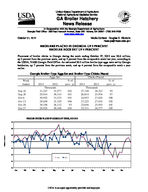
Placement of broiler chicks in Georgia during the week ending October 27, 2012 was 26.6 million, up 2 percent from the previous week, and up 5 percent from the comparable week last year, according to the USDA, NASS Georgia Field Office. An estimated 30.2 million broiler type eggs were set by Georgia hatcheries, up 7 percent from the previous week, and up 4 percent from the comparable week a year earlier.
Georgia Broiler-Type Eggs Set and Broiler-Type Chicks Placed
Eggs Set
Chicks Placed
Week
% of
% of
Ended
2011
2012
prev. yr. 2011
2012
prev. yr.
Thousands
Thousands
Sep 22
31,247 31,977 102
27,748 26,323
95
Sep 29
29,914 30,314 101
26,814 25,976
97
Oct 6
30,952 31,333 101
24,953 27,034 108
Oct 13
29,658 31,329 106
27,225 27,814 102
Oct 20
30,356 28,132
93
25,656 25,953 101
Oct 27
28,924 30,168 104
25,311 26,577 105
BROILER CHICKS PLACED IN GEORGIA BY WEEK, 2011-2012
30
29
28
27
26
25
2011
2012
24
23
Jan
Feb
Mar
Apr
May
Jun
Jul
Aug
Sep
Oct
Nov
Dec
Million Chicks
USDA is an equal opportunity provider and employer.
Broiler-Type Eggs Set 19 Selected States: 2012
State
Alabama .............................................. Arkansas ............................................. Delaware ............................................. Florida ................................................. Georgia ................................................ Kentucky .............................................. Louisiana ............................................. Maryland .............................................. Mississippi ........................................... Missouri ...............................................
September 22, 2012
(1,000 eggs)
27,370 20,859
3,153 1,353 31,977 7,646 3,146 7,119 15,601 7,252
September 29, 2012
(1,000 eggs)
25,744 20,196
3,142 1,351 30,314 7,173 3,122 7,121 16,170 6,914
North Carolina ..................................... Oklahoma ............................................ Pennsylvania ....................................... South Carolina ..................................... Texas ................................................... Virginia ................................................ California, Tennessee,
and West Virginia ..............................
19,206 6,717 3,271 5,042
12,806 6,096
9,413
19,454 6,811 3,608 5,300
13,675 5,490
9,812
19 State total .......................................
188,027
185,397
Previous year total ...............................
187,841
181,765
Percent of previous year .....................
100
102
Week ending
October 6, 2012
October 13, 2012
(1,000 eggs)
(1,000 eggs)
27,088 20,310
3,161 1,351 31,333 7,669 2,977 6,654 16,496 7,823
25,966 17,697
3,158 1,353 31,329 7,554 3,304 7,471 16,543 7,606
18,565 6,936 3,639 4,792
13,220 5,971
17,722 6,287 3,647 4,924
13,014 6,019
9,860
9,599
187,845
183,193
186,317
181,852
101
101
October 20, 2012
(1,000 eggs)
25,458 18,329
3,162 1,088 28,132 6,707 3,298 7,071 16,364 7,210
18,305 6,416 3,279 5,654
12,603 5,543
8,538
177,157
183,537
97
October 27, 2012
(1,000 eggs)
25,755 20,124
3,240 1,353 30,168 7,229 3,183 6,769 16,365 7,867
19,331 6,622 3,369 5,124
13,200 6,195
10,477
186,371
185,172
101
Broiler-Type Chicks Placed 19 Selected States: 2012
State
Alabama .............................................. Arkansas ............................................. Delaware ............................................. Florida ................................................. Georgia ................................................ Kentucky .............................................. Louisiana ............................................. Maryland .............................................. Mississippi ........................................... Missouri ...............................................
September 22, 2012
(1,000 chicks)
19,617 19,973
3,907 972
26,323 6,249 2,897 5,924
14,178 5,513
September 29, 2012
(1,000 chicks)
19,472 17,313
4,261 1,215 25,976 5,682 2,970 5,262 14,363 5,797
Week ending
October 6, 2012
October 13, 2012
(1,000 chicks) (1,000 chicks)
18,901 18,701
4,118 935
27,034 5,690 2,952 5,440
14,301 4,874
19,760 18,906
3,509 935
27,814 6,718 2,845 6,386
13,545 5,327
October 20, 2012
(1,000 chicks)
18,660 18,637
3,720 1,023 25,953 5,762 2,700 6,331 13,616 4,770
October 27, 2012
(1,000 chicks)
19,380 19,258
4,280 1,291 26,577 5,950 2,703 5,239 14,142 5,543
North Carolina ..................................... Oklahoma ............................................ Pennsylvania ....................................... South Carolina ..................................... Texas ................................................... Virginia ................................................ California, Tennessee,
and West Virginia ..............................
15,602 4,247 2,997 4,551
10,858 4,889
10,579
14,737 4,893 2,935 4,424
11,266 4,647
9,473
14,664 4,465 2,778 4,601
10,867 4,228
9,462
14,407 4,782 2,675 3,704
10,735 4,877
9,045
15,110 4,854 3,023 4,127
11,668 4,495
9,835
14,998 4,356 3,059 3,850
11,132 4,494
10,640
19 State total .......................................
159,276
154,686
154,011
155,970
154,284
156,892
Previous year total ...............................
157,901
154,383
148,802
155,108
151,134
153,311
Percent of previous year .....................
101
100
104
101
102
102
Average hatchability for chicks hatched in the 19 selected States during the week was 85 percent. Average hatchability is calculated by dividing chicks hatched during the week by eggs set three weeks earlier.