- Collection:
- Georgia Government Publications
- Serial:
- Broiler hatchery news release / United States Department of Agriculture National Agricultural Statistics Service.
- Title:
- Georgia broiler hatchery news release, 2012 October 24
- Creator:
- Georgia Crop Reporting Service
- Contributor to Resource:
- United States. National Agricultural Statistics Service. Southern Regional Field Office, issuing body.
Alabama. Department of Agriculture and Industries, issuing body.
Florida. Department of Agriculture and Consumer Services, issuing body.
Georgia. Department of Agriculture, issuing body.
South Carolina. Department of Agriculture, issuing body. - Publisher:
- Athens, Ga. : Georgia Agricultural Statistics Service
- Date of Original:
- 2012-10-24
- Subject:
- Poultry--Hatcheries--Georgia--Statistics
Eggs--Production--Georgia--Statistics - Location:
- United States, Georgia, 32.75042, -83.50018
- Medium:
- state government records
- Type:
- Text
- Format:
- application/pdf
- Description:
- Began with: August 28, 2013.
Effective March 12, 2014, name of issuing body appears as Southern Regional Field Office.
August 28, 2013; title from caption (Georgia Government Publications database, viewed January 19, 2018).
January 17, 2018 (received via e-mail on January 18, 2018 from Georgia Department of Agriculture); (Georgia Government Publications database, viewed November 22, 2017). - External Identifiers:
- Call Number GA A400.C7 P1 H2 2012/10-24
- Metadata URL:
- https://dlg.galileo.usg.edu/id:dlg_ggpd_i-ga-ba400-pc7-bp1-bh2-b2012-s10-h24-belec-p-btext
- Digital Object URL:
- https://dlg.galileo.usg.edu/do:dlg_ggpd_i-ga-ba400-pc7-bp1-bh2-b2012-s10-h24-belec-p-btext
- Language:
- eng
- Holding Institution:
- University of Georgia. Map and Government Information Library
- Rights:
-

United States Department of Agriculture National Agricultural Statistics Service
GA Broiler Hatchery News Release
In Cooperation with the Georgia Department of Agriculture Georgia Field Office 355 East Hancock Avenue, Suite 320 Athens, GA 30601 (706) 546-2236
www.nass.usda.gov
October 24, 2012
Media Contact: Douglas G. Kleweno nass-ga@nass.usda.gov
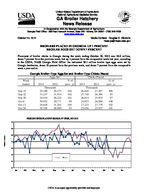
BROILERS PLACED IN GEORGIA UP 1 PERCENT BROILER EGGS SET DOWN 7 PERCENT
Placement of broiler chicks in Georgia during the week ending October 20, 2012 was 26.0 million, down 7 percent from the previous week, but up 1 percent from the comparable week last year, according to the USDA, NASS Georgia Field Office. An estimated 28.1 million broiler type eggs were set by Georgia hatcheries, down 10 percent from the previous week, and down 7 percent from the comparable week a year earlier.
Georgia Broiler-Type Eggs Set and Broiler-Type Chicks Placed
Eggs Set
Chicks Placed
Week
% of
% of
Ended
2011
2012
prev. yr. 2011
2012
prev. yr.
Thousands
Thousands
Sep 15
29,180 30,475 104
26,026 27,497 106
Sep 22
31,247 31,914 102
27,748 26,306
95
Sep 29
29,914 30,224 101
26,814 25,970
97
Oct 6
30,952 30,771
99
24,953 26,969 108
Oct 13
29,658 31,261 105
27,225 27,779 102
Oct 20
30,356 28,089
93
25,656 25,957 101
BROILER CHICKS PLACED IN GEORGIA BY WEEK, 2011-2012
30
29
28
27
26
25
2011
2012
24
23
Jan
Feb
Mar
Apr
May
Jun
Jul
Aug
Sep
Oct
Nov
Dec
Million Chicks
USDA is an equal opportunity provider and employer.
Broiler-Type Eggs Set 19 Selected States: 2012
State
Alabama .............................................. Arkansas ............................................. Delaware ............................................. Florida ................................................. Georgia ................................................ Kentucky .............................................. Louisiana ............................................. Maryland .............................................. Mississippi ........................................... Missouri ...............................................
September 15, 2012
(1,000 eggs)
26,820 19,989
3,155 1,088 30,475 7,007 3,272 7,182 16,606 7,366
September 22, 2012
(1,000 eggs)
27,370 20,859
3,153 1,353 31,914 7,646 3,146 7,119 15,600 7,252
Week ending
September 29, 2012
October 6, 2012
(1,000 eggs)
(1,000 eggs)
25,744 20,196
3,142 1,351 30,224 7,217 3,122 7,121 16,185 6,914
27,144 20,310
3,161 1,351 30,771 7,550 3,287 6,654 16,511 7,823
North Carolina ..................................... Oklahoma ............................................ Pennsylvania ....................................... South Carolina ..................................... Texas ................................................... Virginia ................................................ California, Tennessee,
and West Virginia ..............................
18,361 6,441 3,473 5,513
12,552 5,500
9,643
19,206 6,717 3,271 5,042
12,806 6,096
9,413
19,454 6,811 3,608 5,300
13,675 5,490
9,812
19,099 6,936 3,639 4,792
13,220 5,909
9,860
19 State total .......................................
184,443
187,963
185,366
188,017
Previous year total ...............................
179,528
187,841
181,765
186,317
Percent of previous year .....................
103
100
102
101
October 13, 2012
(1,000 eggs)
25,966 17,697
3,158 1,353 31,261 7,554 3,304 7,471 16,558 7,606
17,722 6,287 3,647 4,924
13,014 6,019
9,599
183,140
181,852
101
October 20, 2012
(1,000 eggs)
25,458 18,329
3,162 1,088 28,089 6,707 3,298 7,071 16,349 7,210
18,305 6,416 3,279 5,654
12,603 5,543
8,538
177,099
183,537
96
Broiler-Type Chicks Placed 19 Selected States: 2012
State
Alabama .............................................. Arkansas ............................................. Delaware ............................................. Florida ................................................. Georgia ................................................ Kentucky .............................................. Louisiana ............................................. Maryland .............................................. Mississippi ........................................... Missouri ...............................................
September 15, 2012
(1,000 chicks)
19,801 20,760
4,033 1,300 27,497 5,828 2,847 5,620 13,447 5,032
September 22, 2012
(1,000 chicks)
19,617 19,973
3,907 972
26,306 6,249 2,897 5,924
14,178 5,513
Week ending
September 29, 2012
October 6, 2012
(1,000 chicks) (1,000 chicks)
19,472 17,313
4,261 1,215 25,970 5,682 2,970 5,262 14,363 5,797
18,901 18,701
4,118 935
26,969 5,690 2,952 5,440
14,301 4,874
October 13, 2012
(1,000 chicks)
19,760 18,906
3,509 935
27,779 6,718 2,845 6,386
13,545 5,327
October 20, 2012
(1,000 chicks)
18,660 18,637
3,720 1,023 25,957 5,732 2,700 6,331 13,616 4,770
North Carolina ..................................... Oklahoma ............................................ Pennsylvania ....................................... South Carolina ..................................... Texas ................................................... Virginia ................................................ California, Tennessee,
and West Virginia ..............................
16,165 4,202 3,140 3,871
11,240 5,424
10,346
15,602 4,247 2,997 4,551
10,858 4,889
10,579
14,737 4,893 2,935 4,424
11,266 4,647
9,473
14,664 4,465 2,778 4,601
10,867 4,228
9,462
14,325 4,782 2,675 3,704
10,735 4,877
9,045
15,110 4,854 3,023 4,127
11,668 4,495
9,835
19 State total .......................................
160,553
159,259
154,680
153,946
155,853
154,258
Previous year total ...............................
160,820
157,901
154,383
148,802
155,108
151,134
Percent of previous year .....................
100
101
100
103
100
102
Average hatchability for chicks hatched in the 19 selected States during the week was 85 percent. Average hatchability is calculated by dividing chicks hatched during the week by eggs set three weeks earlier.