- Collection:
- Georgia Government Publications
- Serial:
- Broiler hatchery news release / United States Department of Agriculture National Agricultural Statistics Service.
- Title:
- Georgia broiler hatchery news release, 2012 October 10
- Creator:
- Georgia Crop Reporting Service
- Contributor to Resource:
- United States. National Agricultural Statistics Service. Southern Regional Field Office, issuing body.
Alabama. Department of Agriculture and Industries, issuing body.
Florida. Department of Agriculture and Consumer Services, issuing body.
Georgia. Department of Agriculture, issuing body.
South Carolina. Department of Agriculture, issuing body. - Publisher:
- Athens, Ga. : Georgia Agricultural Statistics Service
- Date of Original:
- 2012-10-10
- Subject:
- Poultry--Hatcheries--Georgia--Statistics
Eggs--Production--Georgia--Statistics - Location:
- United States, Georgia, 32.75042, -83.50018
- Medium:
- state government records
- Type:
- Text
- Format:
- application/pdf
- Description:
- Began with: August 28, 2013.
Effective March 12, 2014, name of issuing body appears as Southern Regional Field Office.
August 28, 2013; title from caption (Georgia Government Publications database, viewed January 19, 2018).
January 17, 2018 (received via e-mail on January 18, 2018 from Georgia Department of Agriculture); (Georgia Government Publications database, viewed November 22, 2017). - External Identifiers:
- Call Number GA A400.C7 P1 H2 2012/10-10
- Metadata URL:
- https://dlg.galileo.usg.edu/id:dlg_ggpd_i-ga-ba400-pc7-bp1-bh2-b2012-s10-h10-belec-p-btext
- Digital Object URL:
- https://dlg.galileo.usg.edu/do:dlg_ggpd_i-ga-ba400-pc7-bp1-bh2-b2012-s10-h10-belec-p-btext
- Language:
- eng
- Holding Institution:
- University of Georgia. Map and Government Information Library
- Rights:
-

United States Department of Agriculture National Agricultural Statistics Service
GA Broiler Hatchery News Release
In Cooperation with the Georgia Department of Agriculture Georgia Field Office 355 East Hancock Avenue, Suite 320 Athens, GA 30601 (706) 546-2236
www.nass.usda.gov
October 10, 2012
Media Contact: Douglas G. Kleweno nass-ga@nass.usda.gov
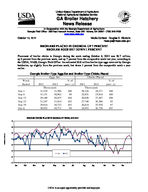
BROILERS PLACED IN GEORGIA UP 7 PERCENT BROILER EGGS SET DOWN 1 PERCENT
Placement of broiler chicks in Georgia during the week ending October 6, 2012 was 26.7 million, up 3 percent from the previous week, and up 7 percent from the comparable week last year, according to the USDA, NASS, Georgia Field Office. An estimated 30.8 million broiler type eggs were set by Georgia hatcheries, up slightly from the previous week, but down 1 percent from the comparable week a year earlier.
Georgia Broiler-Type Eggs Set and Broiler-Type Chicks Placed
Eggs Set
Chicks Placed
Week
% of
% of
Ended
2011
2012
prev. yr. 2011
2012
prev. yr.
Th ou s an ds
Tho us and s
Sep 1
31,519 31,596 100
26,316 26,271 100
Sep 8
31,151 30,962
99
25,851 25,810 100
Sep 15
29,180 30,475 104
26,026 27,497 106
Sep 22
31,247 31,914 102
27,748 26,306
95
Sep 29
29,914 30,722 103
26,814 25,970
97
Oct 6
30,952 30,771
99
24,953 26,726 107
BROILER CHICKS PLACED IN GEORGIA BY WEEK, 2011-2012
30
29
28
27
26
25
2011
2012
24
23
Jan
Feb
Mar
Apr
May
Jun
Jul
Aug
Sep
Oct
Nov
Dec
Million Chicks
USDA is an equal opportunity provider and employer.
Broiler-Type Eggs Set 19 Selected States: 2012
State
Alabama .............................................. Arkansas ............................................. Delaware ............................................. Florida ................................................. Georgia ................................................ Kentucky .............................................. Louisiana ............................................. Maryland .............................................. Mississippi ........................................... Missouri ...............................................
September 1, 2012
(1,000 eggs)
27,312 20,757
3,259 1,347 31,596 7,675 3,211 6,944 16,386 8,019
September 8, 2012
(1,000 eggs)
26,375 19,074
3,143 1,353 30,962 6,682 3,285 6,932 16,740 8,037
Week ending
September 15, September 22,
2012
2012
(1,000 eggs)
(1,000 eggs)
26,820 19,989
3,155 1,088 30,475 7,179 3,272 7,182 16,606 7,366
27,468 20,859
3,153 1,353 31,914 7,416 3,008 7,119 15,600 7,252
September 29, 2012
(1,000 eggs)
26,059 20,187
3,142 1,351 30,722 7,018 3,122 7,121 16,447 6,914
North Carolina ..................................... Oklahoma ............................................ Pennsylvania ....................................... South Carolina ..................................... Texas ................................................... Virginia ................................................ California, Tennessee,
and West Virginia ..............................
19,445 6,693 3,584 4,721
12,855 5,985
10,453
18,217 6,539 3,505 5,402
13,566 5,798
10,076
18,361 6,459 3,473 5,513
12,552 5,500
9,643
19,206 6,736 3,271 4,852
12,806 6,032
9,413
19,370 6,829 3,608 5,300
13,675 5,426
9,581
19 State total .......................................
190,242
185,686
184,633
187,458
185,872
Previous year total ...............................
189,258
185,218
179,528
187,841
181,765
Percent of previous year .....................
101
100
103
100
102
October 6, 2012
(1,000 eggs)
27,144 20,310
3,161 1,351 30,771 7,550 3,287 6,654 16,511 7,823
18,927 6,936 3,518 4,792
13,220 5,909
10,250
188,114
186,317
101
Broiler-Type Chicks Placed 19 Selected States: 2012
State
Alabama .............................................. Arkansas ............................................. Delaware ............................................. Florida ................................................. Georgia ................................................ Kentucky .............................................. Louisiana ............................................. Maryland .............................................. Mississippi ........................................... Missouri ...............................................
September 1, 2012
(1,000 chicks)
20,056 19,027
4,947 1,186 26,271 6,404 2,871 5,738 14,397 5,854
September 8, 2012
(1,000 chicks)
19,993 20,937
4,023 1,105 25,810 6,403 2,857 6,350 14,411 4,937
Week ending
September 15, September 22,
2012
2012
(1,000 chicks) (1,000 chicks)
19,801 20,760
4,033 1,300 27,497 5,828 2,847 5,620 13,447 5,032
19,617 19,973
3,907 972
26,306 6,249 2,818 5,924
14,178 5,513
September 29, 2012
(1,000 chicks)
19,464 17,313
4,261 1,215 25,970 5,679 2,970 5,262 14,355 5,797
October 6, 2012
(1,000 chicks)
18,901 18,700
4,118 935
26,726 5,747 2,952 5,440
14,301 4,874
North Carolina ..................................... Oklahoma ............................................ Pennsylvania ....................................... South Carolina ..................................... Texas ................................................... Virginia ................................................ California, Tennessee,
and West Virginia ..............................
15,827 4,437 2,838 3,847
11,439 3,877
11,021
15,780 3,843 3,040 5,263
10,671 4,503
9,668
16,165 4,202 3,140 3,871
11,240 5,424
10,346
15,602 4,247 2,997 4,373
10,858 4,889
10,579
14,737 4,893 2,935 4,424
11,266 4,647
9,352
14,634 4,465 2,925 4,601
10,867 4,228
9,469
19 State total .......................................
160,037
159,594
160,553
159,002
154,540
153,883
Previous year total ...............................
160,923
160,203
160,820
157,901
154,383
148,802
Percent of previous year .....................
99
100
100
101
100
103
Average hatchability for chicks hatched in the 19 selected States during the week was 85 percent. Average hatchability is calculated by dividing chicks hatched during the week by eggs set three weeks earlier.