- Collection:
- Georgia Government Publications
- Serial:
- Broiler hatchery news release / United States Department of Agriculture National Agricultural Statistics Service.
- Title:
- Georgia broiler hatchery news release, 2012 January 25
- Creator:
- Georgia Crop Reporting Service
- Contributor to Resource:
- United States. National Agricultural Statistics Service. Southern Regional Field Office, issuing body.
Alabama. Department of Agriculture and Industries, issuing body.
Florida. Department of Agriculture and Consumer Services, issuing body.
Georgia. Department of Agriculture, issuing body.
South Carolina. Department of Agriculture, issuing body. - Publisher:
- Athens, Ga. : Georgia Agricultural Statistics Service
- Date of Original:
- 2012-01-25
- Subject:
- Poultry--Hatcheries--Georgia--Statistics
Eggs--Production--Georgia--Statistics - Location:
- United States, Georgia, 32.75042, -83.50018
- Medium:
- state government records
- Type:
- Text
- Format:
- application/pdf
- Description:
- Began with: August 28, 2013.
Effective March 12, 2014, name of issuing body appears as Southern Regional Field Office.
August 28, 2013; title from caption (Georgia Government Publications database, viewed January 19, 2018).
January 17, 2018 (received via e-mail on January 18, 2018 from Georgia Department of Agriculture); (Georgia Government Publications database, viewed November 22, 2017). - External Identifiers:
- Call Number GA A400.C7 P1 H2 2012/1-25
- Metadata URL:
- https://dlg.galileo.usg.edu/id:dlg_ggpd_i-ga-ba400-pc7-bp1-bh2-b2012-s1-h25-belec-p-btext
- Digital Object URL:
- https://dlg.galileo.usg.edu/do:dlg_ggpd_i-ga-ba400-pc7-bp1-bh2-b2012-s1-h25-belec-p-btext
- Language:
- eng
- Holding Institution:
- University of Georgia. Map and Government Information Library
- Rights:
-

United States Department of Agriculture National Agricultural Statistics Service
GA Broiler Hatchery News Release
In Cooperation with the Georgia Department of Agriculture Georgia Field Office 355 East Hancock Avenue, Suite 320 Athens, GA 30601 (706) 546-2236
www.nass.usda.gov
January 25, 2012
Media Contact: Douglas G. Kleweno nass-ga@nass.usda.gov
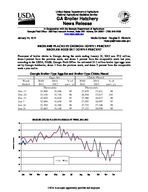
BROILERS PLACED IN GEORGIA DOWN 1 PERCENT BROILER EGGS SET DOWN 5 PERCENT
Placement of broiler chicks in Georgia during the week ending January 21, 2012 was 27.0 million, down 1 percent from the previous week, and down 1 percent from the comparable week last year, according to the USDA, NASS, Georgia Field Office. An estimated 31.1 million broiler type eggs were set by Georgia hatcheries, down 1 from the previous week, and down 5 percent from the comparable week a year earlier.
Georgia Broiler-Type Eggs Set and Broiler-Type Chicks Placed
Eggs Set
Chicks Placed
Week
2010/
2011/
% of 2010/
2011/
% of
Ended
2011
2012
prev. yr. 2011
2012
prev. yr.
Thous ands
Thous ands
Dec 17
33,500 31,846
95
27,679 27,411
99
Dec 24
33,138 31,736
96
26,934 27,617 103
Dec 31
32,829 31,839
97
27,580 26,917
98
Jan 7
32,949 31,430
95
27,955 26,997
97
Jan 14
32,769 31,386
96
27,733 27,346
99
Jan 21
32,685 31,148
95
27,123 26,950
99
BROILER CHICKS PLACED IN GEORGIA BY WEEK, 2011-2012
30
29
28
27
26
25 2011 2012
24
23
Jan Feb Mar Apr
May Jun Jul
Aug Sep
Oct Nov Dec
Million Chicks
USDA is an equal opportunity provider and employer.
Broiler-Type Eggs Set 19 Selected States: 2011 and 2012
State
December 17, 2011
December 24, 2011
Week ending
December 31, 2011
January 7, 2012
(1,000 eggs)
(1,000 eggs)
(1,000 eggs)
(1,000 eggs)
Alabama ............................................. Arkansas ............................................ Delaware ............................................ Florida ................................................ Georgia .............................................. Kentucky ............................................. Louisiana ............................................ Maryland ............................................. Mississippi .......................................... Missouri ..............................................
27,904 20,038
3,124 1,351 31,846 7,716 3,409 7,121 18,337 7,941
27,704 20,121
3,126 1,349 31,736 7,648 3,333 7,483 18,266 7,945
27,562 20,187
3,232 1,347 31,839 7,619 3,348 7,447 17,763 7,433
27,127 20,082
3,265 1,351 31,430 7,635 3,364 7,364 17,573 7,853
North Carolina .................................... Oklahoma ........................................... Pennsylvania ...................................... South Carolina .................................... Texas ................................................. Virginia ............................................... California, Tennessee, and West Virginia ...............................
19,707 6,802 3,927 5,509
14,353 5,813
10,190
20,094 6,710 3,769 5,362
14,054 6,041
11,126
19,927 6,268 3,812 5,164
13,887 5,909
10,709
19,772 6,585 3,662 5,250
14,089 5,694
10,208
19 State total ......................................
195,088
195,867
193,453
192,304
Previous year total ..............................
205,187
205,240
203,224
205,419
Percent of previous year .....................
95
95
95
94
January 14, 2012
(1,000 eggs)
26,905 20,085
3,261 1,351 31,386 7,571 3,379 7,098 17,475 7,623
20,010 6,787 3,875 5,348
13,652 5,939
10,454
192,199
205,099
94
January 21, 2012
(1,000 eggs)
27,092 20,073
3,262 1,353 31,148 7,643 3,440 7,628 18,111 7,677
19,988 6,721 3,877 5,363
14,249 6,231
9,659
193,515
204,116
95
Broiler-Type Chicks Placed 19 Selected States: 2011 and 2012
State
December 17, 2011
December 24, 2011
Week ending
December 31, 2011
January 7, 2012
(1,000 chicks) (1,000 chicks) (1,000 chicks) (1,000 chicks)
Alabama ............................................. Arkansas ............................................ Delaware ............................................ Florida ................................................ Georgia .............................................. Kentucky ............................................. Louisiana ............................................ Maryland ............................................. Mississippi .......................................... Missouri ..............................................
19,985 19,201
4,439 1,073 27,411 5,558 2,955 6,261 15,133 5,895
20,588 19,333
3,355 964
27,617 6,015 2,972 6,667
15,590 5,734
20,811 20,378
4,385 1,160 26,917 6,378 2,943 5,968 15,407 5,004
20,132 19,296
3,952 1,160 26,997 6,098 2,987 5,474 15,542 5,554
January 14, 2012
(1,000 chicks)
19,898 18,012
4,547 1,160 27,346 6,021 2,992 6,060 15,594 6,087
January 21, 2012
(1,000 chicks)
20,269 18,621
4,027 953
26,950 5,990 2,995 6,277
15,060 4,913
North Carolina .................................... Oklahoma ........................................... Pennsylvania ...................................... South Carolina .................................... Texas ................................................. Virginia ............................................... California, Tennessee, and West Virginia ...............................
15,239 4,172 3,114 4,565
12,138 4,571
10,821
15,729 4,264 3,196 4,183
11,667 4,624
10,689
15,635 3,746 3,134 4,115
11,848 4,710
10,339
15,439 4,042 3,196 4,828
11,941 5,698
9,589
15,738 4,693 3,136 4,435
11,772 4,693
10,881
15,694 4,599 3,183 4,221
11,553 4,844
10,619
19 State total ......................................
162,531
163,187
162,878
161,925
163,065
160,768
Previous year total ..............................
170,078
168,134
168,813
168,417
168,220
167,507
Percent of previous year .....................
96
97
96
96
97
96
Average hatchability for chicks hatched in the 19 selected States during the week was 85 percent. Average hatchability is calculated by dividing chicks hatched during the week by eggs set three weeks earlier.