- Collection:
- Georgia Government Publications
- Serial:
- Broiler hatchery news release / United States Department of Agriculture National Agricultural Statistics Service.
- Title:
- Georgia broiler hatchery news release, 2011 August 31
- Creator:
- Georgia Crop Reporting Service
- Contributor to Resource:
- United States. National Agricultural Statistics Service. Southern Regional Field Office, issuing body.
Alabama. Department of Agriculture and Industries, issuing body.
Florida. Department of Agriculture and Consumer Services, issuing body.
Georgia. Department of Agriculture, issuing body.
South Carolina. Department of Agriculture, issuing body. - Publisher:
- Athens, Ga. : Georgia Agricultural Statistics Service
- Date of Original:
- 2011-08-31
- Subject:
- Poultry--Hatcheries--Georgia--Statistics
Eggs--Production--Georgia--Statistics - Location:
- United States, Georgia, 32.75042, -83.50018
- Medium:
- state government records
- Type:
- Text
- Format:
- application/pdf
- Description:
- Began with: August 28, 2013.
Effective March 12, 2014, name of issuing body appears as Southern Regional Field Office.
August 28, 2013; title from caption (Georgia Government Publications database, viewed January 19, 2018).
January 17, 2018 (received via e-mail on January 18, 2018 from Georgia Department of Agriculture); (Georgia Government Publications database, viewed November 22, 2017). - External Identifiers:
- Call Number GA A400.C7 P1 H2 2011/8-31
- Metadata URL:
- https://dlg.galileo.usg.edu/id:dlg_ggpd_i-ga-ba400-pc7-bp1-bh2-b2011-s8-h31-belec-p-btext
- Digital Object URL:
- https://dlg.galileo.usg.edu/do:dlg_ggpd_i-ga-ba400-pc7-bp1-bh2-b2011-s8-h31-belec-p-btext
- Language:
- eng
- Holding Institution:
- University of Georgia. Map and Government Information Library
- Rights:
-

United States Department of Agriculture National Agricultural Statistics Service
GA Broiler Hatchery News Release
In Cooperation with the Georgia Department of Agriculture Georgia Field Office 355 East Hancock Avenue, Suite 320 Athens, GA 30601 (706) 546-2236
www.nass.usda.gov
August 31, 2011
Media Contact: Douglas G. Kleweno nass-ga@nass.usda.gov
BROILERS PLACED IN GEORGIA DOWN 1 PERCENT BROILER EGGS SET DOWN 2 PERCENT
Placement of broiler chicks in Georgia during the week ending August 27, 2011 was 27.4 million, up 4 percent from the previous week, but down 1 percent from the comparable week last year, according to the USDA, NASS, Georgia Field Office.
An estimated 31.6 million broiler type eggs were set by Georgia hatcheries, down slightly from the previous week, and down 2 percent from the comparable week a year earlier. Broiler-type chicks hatched during the week totaled 26.5 million, up 1 percent from the previous week, but down 1 percent from the comparable week a year earlier.
GEORGIA BROILER TYPE EGGS SET, CHICKS HATCHED, AND CHICKS PLACED
Eggs Set
Chicks Hatched
Chicks Placed
Week
% of
% of
% of
Ended 2010 2011 prev. yr. 2010 2011 prev. yr. 2010 2011 prev. yr.
Thousands
Thousands
Thousands
Jul 23
32,349 32,256 100
26,049 27,509 106
26,583 28,065 106
Jul 30
32,430 31,388 97
26,362 27,155 103
27,078 27,696 102
Aug 6
32,358 31,538 97
26,896 27,025 100
27,599 27,749 101
Aug 13
31,922 31,666 99
26,867 27,060 101
27,694 27,114 98
Aug 20
32,694 31,793 97
26,972 26,299 98
26,333 26,255 100
Aug 27
32,134 31,649 98
26,759 26,531 99
27,530 27,358 99
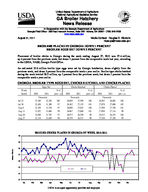
Million Chicks
BROILER CHICKS PLACED IN GEORGIA BY WEEK, 2010 -2011
30
29
28
27
26
25
2010
2011
24
23
Jan
Feb
Mar
Apr
May
Jun
Jul
Aug
Sep
USDA is an equal opportunity provider and employer.
Oct
Nov
Dec
Broiler-Type Eggs Set 19 Selected States: 2011
State
Alabama ............................................. Arkansas ............................................ Delaware ............................................ Florida ................................................ Georgia .............................................. Kentucky ............................................. Louisiana ............................................ Maryland ............................................. Mississippi .......................................... North Carolina ....................................
July 23, 2011
(1,000 eggs)
27,358 20,058
2,920 1,352 32,256 7,733 3,258 7,644 18,417 19,737
Oklahoma ........................................... Pennsylvania ...................................... South Carolina .................................... Texas ................................................. Virginia ............................................... California, Missouri,
Tennessee, and West Virginia ..........
6,628 4,031 5,476 14,550 5,808
18,345
19 State total ......................................
195,571
Previous year total ..............................
208,724
Percent of previous year .....................
94
July 30, 2011
(1,000 eggs)
27,347 20,818
3,022 1,382 31,388 7,627 3,258 7,510 18,418 19,845
6,610 3,768 5,405 14,716 5,787
18,104
195,005
208,549
94
Week ending
August 6, 2011
August 13, 2011
(1,000 eggs)
(1,000 eggs)
27,308 20,795
3,167 1,370 31,538 7,773 3,288 7,511 18,563 19,570
27,157 20,920
3,161 1,347 31,666 7,789 3,273 7,460 18,440 19,303
6,489 3,933 5,140 14,571 5,764
6,651 3,764 5,404 13,738 5,543
19,044
19,090
195,824
194,706
207,588
206,602
94
94
August 20, 2011
(1,000 eggs)
26,581 20,651
3,015 1,352 31,793 7,864 3,243 7,451 18,312 19,518
6,713 3,510 5,353 13,462 5,826
18,598
193,242
207,381
93
August 27, 2011
(1,000 eggs)
26,936 20,994
2,886 1,364 31,649 7,878 3,167 7,645 17,602 19,364
6,702 3,809 5,413 13,466 5,291
18,273
192,439
206,575
93
Broiler-Type Chicks Placed 19 Selected States: 2011
State
Alabama ............................................. Arkansas ............................................ Delaware ............................................ Florida ................................................ Georgia .............................................. Kentucky ............................................. Louisiana ............................................ Maryland ............................................. Mississippi .......................................... North Carolina ....................................
July 23, 2011
(1,000 chicks)
19,810 18,983
4,770 1,209 28,065 5,881 2,969 5,721 15,901 15,747
July 30, 2011
(1,000 chicks)
19,449 20,542
4,403 1,184 27,696 6,479 2,983 4,661 15,845 16,115
Week ending
August 6, 2011
August 13, 2011
(1,000 chicks) (1,000 chicks)
19,200 18,433
4,023 1,225 27,749 6,138 2,960 6,940 15,919 16,069
19,637 19,788
4,853 1,145 27,114 6,077 2,959 5,253 16,013 16,206
August 20, 2011
(1,000 chicks)
19,619 19,180
4,741 1,150 26,255 6,081 2,967 4,876 16,160 15,596
August 27, 2011
(1,000 chicks)
18,571 18,514
4,890 1,147 27,358 6,816 2,993 5,294 16,186 15,708
Oklahoma ........................................... Pennsylvania ...................................... South Carolina .................................... Texas ................................................. Virginia ............................................... California, Missouri,
Tennessee, and West Virginia ..........
4,057 3,122 3,758 12,510 4,375
16,476
3,457 3,030 4,051 12,685 5,518
15,379
4,859 3,308 4,219 12,421 4,221
16,798
3,820 3,264 4,051 12,372 5,130
15,278
4,160 3,078 4,008 12,571 5,564
15,661
4,711 3,228 4,595 12,522 4,911
16,174
19 State total ......................................
163,354
163,477
164,482
162,960
161,667
163,618
Previous year total ..............................
169,782
170,569
173,173
171,985
171,749
170,866
Percent of previous year .....................
96
96
95
95
94
96
Average hatchability for chicks hatched in the 19 selected States during the week was 85 percent. Average hatchability is calculated by dividing chicks hatched during the week by eggs set three weeks earlier.