- Collection:
- Georgia Government Publications
- Serial:
- Broiler hatchery news release / United States Department of Agriculture National Agricultural Statistics Service.
- Title:
- Georgia broiler hatchery news release, 2011 August 3
- Creator:
- Georgia Crop Reporting Service
- Contributor to Resource:
- United States. National Agricultural Statistics Service. Southern Regional Field Office, issuing body.
Alabama. Department of Agriculture and Industries, issuing body.
Florida. Department of Agriculture and Consumer Services, issuing body.
Georgia. Department of Agriculture, issuing body.
South Carolina. Department of Agriculture, issuing body. - Publisher:
- Athens, Ga. : Georgia Agricultural Statistics Service
- Date of Original:
- 2011-08-03
- Subject:
- Poultry--Hatcheries--Georgia--Statistics
Eggs--Production--Georgia--Statistics - Location:
- United States, Georgia, 32.75042, -83.50018
- Medium:
- state government records
- Type:
- Text
- Format:
- application/pdf
- Description:
- Began with: August 28, 2013.
Effective March 12, 2014, name of issuing body appears as Southern Regional Field Office.
August 28, 2013; title from caption (Georgia Government Publications database, viewed January 19, 2018).
January 17, 2018 (received via e-mail on January 18, 2018 from Georgia Department of Agriculture); (Georgia Government Publications database, viewed November 22, 2017). - External Identifiers:
- Call Number GA A400.C7 P1 H2 2011/8-3
- Metadata URL:
- https://dlg.galileo.usg.edu/id:dlg_ggpd_i-ga-ba400-pc7-bp1-bh2-b2011-s8-h3-belec-p-btext
- Digital Object URL:
- https://dlg.galileo.usg.edu/do:dlg_ggpd_i-ga-ba400-pc7-bp1-bh2-b2011-s8-h3-belec-p-btext
- Language:
- eng
- Holding Institution:
- University of Georgia. Map and Government Information Library
- Rights:
-

United States Department of Agriculture National Agricultural Statistics Service
GA Broiler Hatchery News Release
In Cooperation with the Georgia Department of Agriculture Georgia Field Office 355 East Hancock Avenue, Suite 320 Athens, GA 30601 (706) 546-2236
www.nass.usda.gov
August 3, 2011
Media Contact: Douglas G. Kleweno nass-ga@nass.usda.gov
BROILERS PLACED IN GEORGIA UP 2 PERCENT BROILER EGGS SET DOWN 4 PERCENT
Placement of broiler chicks in Georgia during the week ending July 30, 2011 was 27.7 million, down 1 percent from the previous week, but up 2 percent from the comparable week last year, according to the USDA, NASS, Georgia Field Office.
An estimated 31.1 million broiler type eggs were set by Georgia hatcheries, down 4 percent from the previous week, and down 4 percent from the comparable week a year earlier. Broiler-type chicks hatched during the week totaled 27.2 million, down 1 percent from the previous week, but up 3 percent from the comparable week a year earlier.
GEORGIA BROILER TYPE EGGS SET, CHICKS HATCHED, AND CHICKS PLACED
Eggs Set
Chicks Hatched
Chicks Placed
Week
% of
% of
% of
Ended 2010 2011 prev. yr. 2010 2011 prev. yr. 2010 2011 prev. yr.
Thousands
Thousands
Thousands
Jun 25
32,435 32,225 99 27,048 28,092 104 26,601 28,027 105
Jul 2
31,394 32,833 105 27,122 28,105 104 27,777 27,547 99
Jul 9
31,599 32,505 103 26,765 27,592 103 26,758 28,489 106
Jul 16
32,298 32,004 99 27,017 26,947 100 27,141 27,466 101
Jul 23
32,349 32,247 100 26,049 27,509 106 26,583 28,051 106
Jul 30
32,430 31,089 96 26,362 27,155 103 27,078 27,726 102
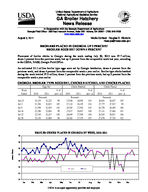
Million Chicks
BROILER CHICKS PLACED IN GEORGIA BY WEEK, 2010 -2011
30
29
28
27
26
25
2010
2011
24
23
Jan
Feb
Mar
Apr
May
Jun
Jul
Aug
Sep
USDA is an equal opportunity provider and employer.
Oct
Nov
Dec
Broiler-Type Eggs Set 19 Selected States: 2011
State
Alabama ............................................. Arkansas ............................................ Delaware ............................................ Florida ................................................ Georgia .............................................. Kentucky ............................................. Louisiana ............................................ Maryland ............................................. Mississippi .......................................... North Carolina ....................................
June 25, 2011
(1,000 eggs)
27,776 22,066
2,940 1,360 32,225 7,745 3,288 7,645 18,494 19,433
Oklahoma ........................................... Pennsylvania ...................................... South Carolina .................................... Texas ................................................. Virginia ............................................... California, Missouri,
Tennessee, and West Virginia ..........
6,821 4,050 5,409 14,915 6,077
18,828
19 State total ......................................
199,072
Previous year total ..............................
211,324
Percent of previous year .....................
94
July 2, 2011
(1,000 eggs)
27,532 20,935
2,770 1,360 32,833 7,413 3,273 7,600 18,101 19,463
6,700 3,854 5,250 14,951 6,079
19,722
197,836
207,492
95
Week ending
July 9, 2011
July 16, 2011
(1,000 eggs)
(1,000 eggs)
27,369 21,087
2,656 1,327 32,505 7,907 3,273 7,624 18,200 19,543
27,325 20,573
2,920 1,353 32,004 7,963 3,258 7,620 18,293 20,095
6,519 3,651 5,424 14,750 6,057
6,856 4,080 5,028 14,449 5,861
17,859
19,324
195,751
197,002
206,138
209,753
95
94
July 23, 2011
(1,000 eggs)
27,370 20,072
2,920 1,352 32,247 7,675 3,258 7,644 18,417 19,797
6,628 4,031 5,476 14,579 5,808
18,385
195,659
208,724
94
July 30, 2011
(1,000 eggs)
27,295 20,970
3,022 1,382 31,089 7,593 3,258 7,510 18,418 19,845
6,610 3,733 5,404 14,837 5,787
18,269
195,022
208,549
94
Broiler-Type Chicks Placed 19 Selected States: 2011
State
Alabama ............................................. Arkansas ............................................ Delaware ............................................ Florida ................................................ Georgia .............................................. Kentucky ............................................. Louisiana ............................................ Maryland ............................................. Mississippi .......................................... North Carolina ....................................
June 25, 2011
(1,000 chicks)
20,723 21,340
4,270 1,352 28,027 6,648 2,940 5,815 16,294 16,510
July 2, 2011
(1,000 chicks)
20,899 20,799
4,738 1,289 27,547 6,444 2,902 5,169 16,242 16,286
Week ending
July 9, 2011
July 16, 2011
(1,000 chicks) (1,000 chicks)
19,453 19,876
5,022 1,222 28,489 6,579 2,960 5,425 15,765 15,088
20,239 19,093
4,737 1,223 27,466 6,099 2,968 5,603 15,904 15,911
July 23, 2011
(1,000 chicks)
19,810 18,983
4,770 1,209 28,051 5,881 2,969 5,721 15,901 15,747
July 30, 2011
(1,000 chicks)
19,511 20,542
4,403 1,184 27,726 6,479 2,983 4,661 15,623 16,200
Oklahoma ........................................... Pennsylvania ...................................... South Carolina .................................... Texas ................................................. Virginia ............................................... California, Missouri,
Tennessee, and West Virginia ..........
4,498 3,098 4,618 12,486 4,883
15,803
4,254 3,294 5,105 12,620 4,981
16,934
3,296 3,126 4,364 12,658 4,862
18,154
4,635 3,212 3,792 12,802 4,584
17,008
4,057 3,122 3,758 12,505 4,375
16,490
3,457 2,965 4,075 12,681 5,518
15,417
19 State total ......................................
169,305
169,503
166,339
165,276
163,349
163,425
Previous year total ..............................
176,115
175,093
173,501
174,319
169,782
170,569
Percent of previous year .....................
96
97
96
95
96
96
Average hatchability for chicks hatched in the 19 selected States during the week was 85 percent. Average hatchability is calculated by dividing chicks hatched during the week by eggs set three weeks earlier.