- Collection:
- Georgia Government Publications
- Serial:
- Broiler hatchery news release / United States Department of Agriculture National Agricultural Statistics Service.
- Title:
- Georgia broiler hatchery news release, 2011 August 10
- Creator:
- Georgia Crop Reporting Service
- Contributor to Resource:
- United States. National Agricultural Statistics Service. Southern Regional Field Office, issuing body.
Alabama. Department of Agriculture and Industries, issuing body.
Florida. Department of Agriculture and Consumer Services, issuing body.
Georgia. Department of Agriculture, issuing body.
South Carolina. Department of Agriculture, issuing body. - Publisher:
- Athens, Ga. : Georgia Agricultural Statistics Service
- Date of Original:
- 2011-08-10
- Subject:
- Poultry--Hatcheries--Georgia--Statistics
Eggs--Production--Georgia--Statistics - Location:
- United States, Georgia, 32.75042, -83.50018
- Medium:
- state government records
- Type:
- Text
- Format:
- application/pdf
- Description:
- Began with: August 28, 2013.
Effective March 12, 2014, name of issuing body appears as Southern Regional Field Office.
August 28, 2013; title from caption (Georgia Government Publications database, viewed January 19, 2018).
January 17, 2018 (received via e-mail on January 18, 2018 from Georgia Department of Agriculture); (Georgia Government Publications database, viewed November 22, 2017). - External Identifiers:
- Call Number GA A400.C7 P1 H2 2011/8-10
- Metadata URL:
- https://dlg.galileo.usg.edu/id:dlg_ggpd_i-ga-ba400-pc7-bp1-bh2-b2011-s8-h10-belec-p-btext
- Digital Object URL:
- https://dlg.galileo.usg.edu/do:dlg_ggpd_i-ga-ba400-pc7-bp1-bh2-b2011-s8-h10-belec-p-btext
- Language:
- eng
- Holding Institution:
- University of Georgia. Map and Government Information Library
- Rights:
-

United States Department of Agriculture National Agricultural Statistics Service
GA Broiler Hatchery News Release
In Cooperation with the Georgia Department of Agriculture Georgia Field Office 355 East Hancock Avenue, Suite 320 Athens, GA 30601 (706) 546-2236
www.nass.usda.gov
August 10, 2011
Media Contact: Douglas G. Kleweno nass-ga@nass.usda.gov
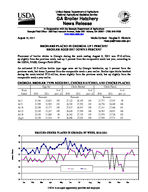
BROILERS PLACED IN GEORGIA UP 1 PERCENT BROILER EGGS SET DOWN 3 PERCENT
Placement of broiler chicks in Georgia during the week ending August 6, 2011 was 27.8 million, up slightly from the previous week, and up 1 percent from the comparable week last year, according to the USDA, NASS, Georgia Field Office.
An estimated 31.5 million broiler type eggs were set by Georgia hatcheries, up 1 percent from the previous week, but down 3 percent from the comparable week a year earlier. Broiler-type chicks hatched during the week totaled 27.0 million, down slightly from the previous week, but up slightly from the comparable week a year earlier.
GEORGIA BROILER TYPE EGGS SET, CHICKS HATCHED, AND CHICKS PLACED
Eggs Set
Chicks Hatched
Chicks Placed
Week
% of
% of
% of
Ended 2010 2011 prev. yr. 2010 2011 prev. yr. 2010 2011 prev. yr.
Thousands
Thousands
Thousands
Jul 2
31,394 32,833 105 27,122 28,105 104 27,777 27,547 99
Jul 9
31,599 32,505 103 26,765 27,592 103 26,758 28,489 106
Jul 16
32,298 32,177 100 27,017 26,947 100 27,141 27,466 101
Jul 23
32,349 32,247 100 26,049 27,509 106 26,583 28,051 106
Jul 30
32,430 31,089 96 26,362 27,155 103 27,078 27,726 102
Aug 6
32,358 31,518 97 26,896 27,025 100 27,599 27,771 101
Million Chicks
30 29 28 27 26 25 24 23
Jan
BROILER CHICKS PLACED IN GEORGIA BY WEEK, 2010 -2011
2010
2011
Feb
Mar
Apr
May
Jun
Jul
Aug
Sep
Oct
USDA is an equal opportunity provider and employer.
Nov
Dec
Broiler-Type Eggs Set 19 Selected States: 2011
State
Alabama ............................................. Arkansas ............................................ Delaware ............................................ Florida ................................................ Georgia .............................................. Kentucky ............................................. Louisiana ............................................ Maryland ............................................. Mississippi .......................................... North Carolina ....................................
July 2, 2011
(1,000 eggs)
27,532 20,935
2,770 1,360 32,833 7,413 3,273 7,600 18,101 19,463
Oklahoma ........................................... Pennsylvania ...................................... South Carolina .................................... Texas ................................................. Virginia ............................................... California, Missouri,
Tennessee, and West Virginia ..........
6,700 3,854 5,250 14,957 6,079
19,722
19 State total ......................................
197,842
Previous year total ..............................
207,492
Percent of previous year .....................
95
July 9, 2011
(1,000 eggs)
27,369 21,087
2,656 1,327 32,505 7,907 3,273 7,624 18,200 19,543
6,519 3,651 5,424 14,756 6,057
17,859
195,757
206,138
95
Week ending
July 16, 2011
July 23, 2011
(1,000 eggs)
(1,000 eggs)
27,244 20,573
2,920 1,353 32,177 7,960 3,258 7,620 18,293 20,095
27,370 20,072
2,920 1,352 32,247 7,675 3,258 7,644 18,417 19,797
6,856 4,080 5,028 14,420 5,861
6,628 4,031 5,476 14,550 5,808
19,324
18,385
197,062
195,630
209,753
208,724
94
94
July 30, 2011
(1,000 eggs)
27,297 20,970
3,022 1,382 31,089 7,593 3,258 7,510 18,418 19,845
6,610 3,768 5,405 14,809 5,787
18,136
194,899
208,549
93
August 6, 2011
(1,000 eggs)
27,333 20,810
3,167 1,362 31,518 7,754 3,288 7,511 18,563 19,570
6,489 3,993 5,140 14,695 5,764
19,076
196,033
207,588
94
Broiler-Type Chicks Placed 19 Selected States: 2011
State
Alabama ............................................. Arkansas ............................................ Delaware ............................................ Florida ................................................ Georgia .............................................. Kentucky ............................................. Louisiana ............................................ Maryland ............................................. Mississippi .......................................... North Carolina ....................................
July 2, 2011
(1,000 chicks)
20,899 20,799
4,738 1,289 27,547 6,444 2,902 5,169 16,242 16,286
July 9, 2011
(1,000 chicks)
19,453 19,876
5,022 1,222 28,489 6,579 2,960 5,425 15,765 15,088
Week ending
July 16, 2011
July 23, 2011
(1,000 chicks) (1,000 chicks)
20,239 19,093
4,737 1,223 27,466 6,099 2,968 5,603 15,904 15,911
19,810 18,983
4,770 1,209 28,051 5,881 2,969 5,721 15,901 15,747
July 30, 2011
(1,000 chicks)
19,449 20,542
4,403 1,184 27,726 6,479 2,983 4,661 15,845 16,241
August 6, 2011
(1,000 chicks)
19,236 18,433
4,023 1,216 27,771 6,138 2,960 6,940 15,881 16,089
Oklahoma ........................................... Pennsylvania ...................................... South Carolina .................................... Texas ................................................. Virginia ............................................... California, Missouri,
Tennessee, and West Virginia ..........
4,254 3,294 5,105 12,620 4,981
16,934
3,296 3,126 4,364 12,663 4,862
18,154
4,635 3,212 3,792 12,807 4,584
17,008
4,057 3,122 3,758 12,510 4,375
16,490
3,457 3,030 4,051 12,685 5,518
15,417
4,859 3,329 4,219 12,321 4,221
16,823
19 State total ......................................
169,503
166,344
165,281
163,354
163,671
164,459
Previous year total ..............................
175,093
173,501
174,319
169,782
170,569
173,173
Percent of previous year .....................
97
96
95
96
96
95
Average hatchability for chicks hatched in the 19 selected States during the week was 85 percent. Average hatchability is calculated by dividing chicks hatched during the week by eggs set three weeks earlier.