- Collection:
- Georgia Government Publications
- Serial:
- Broiler hatchery news release / United States Department of Agriculture National Agricultural Statistics Service.
- Title:
- Georgia broiler hatchery news release, 2010 August 18
- Creator:
- Georgia Crop Reporting Service
- Contributor to Resource:
- United States. National Agricultural Statistics Service. Southern Regional Field Office, issuing body.
Alabama. Department of Agriculture and Industries, issuing body.
Florida. Department of Agriculture and Consumer Services, issuing body.
Georgia. Department of Agriculture, issuing body.
South Carolina. Department of Agriculture, issuing body. - Publisher:
- Athens, Ga. : Georgia Agricultural Statistics Service
- Date of Original:
- 2010-08-18
- Subject:
- Poultry--Hatcheries--Georgia--Statistics
Eggs--Production--Georgia--Statistics - Location:
- United States, Georgia, 32.75042, -83.50018
- Medium:
- state government records
- Type:
- Text
- Format:
- application/pdf
- Description:
- Began with: August 28, 2013.
Effective March 12, 2014, name of issuing body appears as Southern Regional Field Office.
August 28, 2013; title from caption (Georgia Government Publications database, viewed January 19, 2018).
January 17, 2018 (received via e-mail on January 18, 2018 from Georgia Department of Agriculture); (Georgia Government Publications database, viewed November 22, 2017). - External Identifiers:
- Call Number GA A400.C7 P1 H2 2010/8-18
- Metadata URL:
- https://dlg.galileo.usg.edu/id:dlg_ggpd_i-ga-ba400-pc7-bp1-bh2-b2010-s8-h18-belec-p-btext
- Digital Object URL:
- https://dlg.galileo.usg.edu/do:dlg_ggpd_i-ga-ba400-pc7-bp1-bh2-b2010-s8-h18-belec-p-btext
- Language:
- eng
- Holding Institution:
- University of Georgia. Map and Government Information Library
- Rights:
-

United States Department of Agriculture
GA Broiler Hatchery News Release
In Cooperation with the Georgia Department of Agriculture Georgia Field Office 355 East Hancock Avenue, Suite 320 Athens, GA 30601 (706) 546-2236
www.nass.usda.gov
August 18, 2010
Media Contact: Douglas G. Kleweno nass-ga@nass.usda.gov
BROILERS PLACED IN GEORGIA UP 6 PERCENT BROILER EGGS SET UP SLIGHTLY
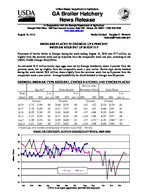
Placement of broiler chicks in Georgia during the week ending August 14, 2010 was 27.7 million, up slightly from the previous week and up 6 percent from the comparable week last year, according to the USDA, NASS, Georgia Field Office.
An estimated 31.9 million broiler type eggs were set by Georgia hatcheries, down 2 percent from the previous week, but up slightly from the comparable week a year earlier. Broiler-type chicks hatched during the week totaled 26.9 million, down slightly from the previous week, but up 6 percent from the comparable week a year earlier. Average hatchability for chicks hatched in Georgia was 83 percent.
GEORGIA BROILER TYPE EGGS SET, CHICKS HATCHED, AND CHICKS PLACED
Eggs Set1/
Chicks Hatched
Net Cross State Movement of Chicks
Chicks Placed
Week
% of
% of
% of
Ended 2009 2010 prev. yr. 2009 2010 prev. yr. 2009
2010 2009 2010 prev. yr.
Thousands
Thousands
Thousands
Thousands
Jul 10 31,731 31,599 100 26,846 26,765 100 +332 +522 26,524 26,758 101
Jul 17 31,726 32,298 102 26,317 27,017 103 +911 +651 26,668 27,051 101
Jul 24 30,329 32,349 107 26,362 26,049 99 +747 +1088 26,528 26,493 100
Jul 31 31,471 32,430 103 26,371 26,362 100 +1146 +1306 26,953 27,077 100
Aug 7 31,309 32,358 103 26,707 26,896 * 101 +275 +1373 * 26,391 27,600 * 105 *
Aug 14 31,811 31,861 100 25,371 26,867 106 +1316 +1508 26,026 27,694 106
1/ Includes eggs set by hatcheries producing chicks for hatchery supply flocks. * Revised.
BROILER CHICKS PLACED IN GEORGIA BY WEEK, 2009-2010
29
28
27
Million Chicks
26
25
24
2009
2010
23
22
Jan Feb Mar Apr
May Jun
Jul
Aug Sep
Oct Nov Dec
USDA is an equal opportunity provider and employer.
Broiler-Type Eggs Set 19 Selected States: 2010
State
Alabama ................................................ Arkansas ............................................... Delaware ............................................... Florida ................................................... Georgia ................................................. Kentucky ................................................ Louisiana ............................................... Maryland ................................................ Mississippi ............................................. North Carolina .......................................
Oklahoma .............................................. Pennsylvania ......................................... South Carolina ....................................... Texas .................................................... Virginia .................................................. California, Missouri,
Tennessee, and West Virginia .............
19 State total .........................................
Previous year total .................................
Percent of previous year ........................
July 10, 2010
(1,000 eggs)
30,772 23,205
3,879 1,390 31,599 7,545 3,470 7,723 18,838 20,031
6,211 3,367 5,937 15,975 6,637
19,238
205,817
202,101
102
July 17, 2010
(1,000 eggs)
30,745 24,193
3,913 1,389 32,298 7,874 3,122 8,149 19,374 20,353
6,539 3,642 5,750 16,068 6,410
19,606
209,425
204,579
102
Week ending
July 24, 2010
July 31, 2010
(1,000 eggs) (1,000 eggs)
30,629 23,705
3,915 1,391 32,349 7,597 3,409 7,855 19,414 19,960
30,373 24,037
3,915 1,358 32,430 7,995 3,372 7,767 19,429 20,097
6,246 3,913 6,065 15,967 6,721
6,554 3,634 5,779 15,725 6,263
19,263
19,449
208,399
208,177
201,353
201,806
103
103
August 7, 2010
(1,000 eggs)
30,364 23,981
3,920 1,358 32,358 7,354 3,424 7,723 19,010 19,677
6,352 3,797 6,135 15,970 6,106
19,540
207,069
200,277
103
August 14, 2010
(1,000 eggs)
29,924 23,013
3,916 1,358 31,861 7,682 3,440 7,755 19,029 19,961
6,404 3,855 6,017 15,696 6,081
19,612
205,604
201,307
102
Broiler-Type Chicks Placed 19 Selected States: 2010
State
Alabama ................................................ Arkansas ............................................... Delaware ............................................... Florida ................................................... Georgia ................................................. Kentucky ................................................ Louisiana ............................................... Maryland ................................................ Mississippi ............................................. North Carolina .......................................
July 10, 2010
(1,000 chicks)
22,254 21,451
4,762 980
26,758 5,946 3,140 6,539
16,681 15,596
July 17, 2010
(1,000 chicks)
21,382 20,958
4,685 1,007 27,051 6,021 3,108 6,136 16,996 15,827
Week ending
July 24, 2010
July 31, 2010
(1,000 chicks) (1,000 chicks)
22,328 21,622
4,960 1,028 26,493 5,729 3,246 5,974 16,312 15,008
21,265 21,238
5,184 1,038 27,077 6,453 3,137 5,748 16,310 15,816
August 7, 2010
(1,000 chicks)
21,106 21,567
4,181 1,056 27,600 6,616 2,814 7,178 17,031 16,065
August 14, 2010
(1,000 chicks)
21,679 19,751
4,826 1,057 27,694 6,364 3,183 6,577 16,714 15,871
Oklahoma .............................................. Pennsylvania ......................................... South Carolina ....................................... Texas .................................................... Virginia .................................................. California, Missouri,
Tennessee, and West Virginia .............
4,663 3,082 4,799 13,571 5,361
17,664
4,802 3,159 5,371 13,683 5,413
18,347
3,329 3,022 5,147 12,336 5,355
17,308
4,328 2,723 4,751 13,434 5,524
16,216
4,783 2,923 4,781 13,666 4,999
16,437
4,827 3,146 4,325 13,290 5,098
17,524
19 State total .........................................
173,247
173,946
169,197
170,242
172,803
171,926
Previous year total .................................
169,460
168,472
166,973
167,724
169,883
167,559
Percent of previous year ........................
102
103
101
102
102
103
Average hatchability for chicks hatched in the 19 selected States during the week was 84 percent. Average hatchability is calculated by dividing chicks hatched during the week by eggs set three weeks earlier.