- Collection:
- Georgia Government Publications
- Serial:
- Broiler hatchery news release / United States Department of Agriculture National Agricultural Statistics Service.
- Title:
- Georgia broiler hatchery news release, 2010 October 13
- Creator:
- Georgia Crop Reporting Service
- Contributor to Resource:
- United States. National Agricultural Statistics Service. Southern Regional Field Office, issuing body.
Alabama. Department of Agriculture and Industries, issuing body.
Florida. Department of Agriculture and Consumer Services, issuing body.
Georgia. Department of Agriculture, issuing body.
South Carolina. Department of Agriculture, issuing body. - Publisher:
- Athens, Ga. : Georgia Agricultural Statistics Service
- Date of Original:
- 2010-10-13
- Subject:
- Poultry--Hatcheries--Georgia--Statistics
Eggs--Production--Georgia--Statistics - Location:
- United States, Georgia, 32.75042, -83.50018
- Medium:
- state government records
- Type:
- Text
- Format:
- application/pdf
- Description:
- Began with: August 28, 2013.
Effective March 12, 2014, name of issuing body appears as Southern Regional Field Office.
August 28, 2013; title from caption (Georgia Government Publications database, viewed January 19, 2018).
January 17, 2018 (received via e-mail on January 18, 2018 from Georgia Department of Agriculture); (Georgia Government Publications database, viewed November 22, 2017). - External Identifiers:
- Call Number GA A400.C7 P1 H2 2010/10-13
- Metadata URL:
- https://dlg.galileo.usg.edu/id:dlg_ggpd_i-ga-ba400-pc7-bp1-bh2-b2010-s10-h13-belec-p-btext
- Digital Object URL:
- https://dlg.galileo.usg.edu/do:dlg_ggpd_i-ga-ba400-pc7-bp1-bh2-b2010-s10-h13-belec-p-btext
- Language:
- eng
- Holding Institution:
- University of Georgia. Map and Government Information Library
- Rights:
-

United States Department of Agriculture National Agricultural Statistics Service
GA Broiler Hatchery News Release
In Cooperation with the Georgia Department of Agriculture Georgia Field Office 355 East Hancock Avenue, Suite 320 Athens, GA 30601 (706) 546-2236
www.nass.usda.gov
October 13, 2010
Media Contact: Douglas G. Kleweno nass-ga@nass.usda.gov
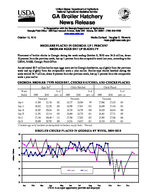
BROILERS PLACED IN GEORGIA UP 1 PERCENT BROILER EGGS SET UP SLIGHLTY
Placement of broiler chicks in Georgia during the week ending October 9, 2010 was 24.8 million, down 10 percent from the previous week, but up 1 percent from the comparable week last year, according to the USDA, NASS, Georgia Field Office.
An estimated 30.7 million broiler type eggs were set by Georgia hatcheries, up slightly from the previous week and up slightly from the comparable week a year earlier. Broiler-type chicks hatched during the week totaled 24.7 million, down 9 percent from the previous week, but up 1 percent from the comparable week a year earlier.
GEORGIA BROILER TYPE EGGS SET, CHICKS HATCHED, AND CHICKS PLACED
Eggs Set1/
Chicks Hatched
Chicks Placed
Week
% of
% of
% of
Ended 2009 2010 prev. yr. 2009 2010 prev. yr. 2009 2010 prev. yr.
Thousands
Thousands
Thousands
Sep 4
31,504 32,136 102 26,737 26,564 99 27,066 27,425 101
Sep 11
30,922 32,258 104 26,598 27,031 102 26,849 27,164 101
Sep 18
29,307 29,626 101 26,728 26,758 100 26,629 26,654 100
Sep 25
31,291 32,314 103 26,494 26,735 101 26,461 27,731 105
Oct 2
27,336 30,648 * 112 25,768 27,025 105 25,985 27,586 106
Oct 9
30,699 30,705 100 24,516 24,673 101 24,510 24,761 101
1/ Includes eggs set by hatcheries producing chicks for hatchery supply flocks. * Revised.
BROILER CHICKS PLACED IN GEORGIA BY WEEK, 2009 -2010
29
28
27
Million Chicks
26
25
24
2009
2010
23
22
Jan
Feb
Mar
Apr
May
Jun
Jul
Aug
Sep
USDA is an equal opportunity provider and employer.
Oct
Nov
Dec
Broiler-Type Eggs Set 19 Selected States: 2010
State
Alabama ............................................. Arkansas ............................................ Delaware ............................................ Florida ................................................ Georgia .............................................. Kentucky ............................................. Louisiana ............................................ Maryland ............................................. Mississippi .......................................... North Carolina ....................................
September 4, 2010
(1,000 eggs)
30,543 22,874
3,916 1,357 32,136 7,790 3,409 6,998 18,336 18,832
September 11, 2010
(1,000 eggs)
29,419 24,046
3,801 1,344 32,258 7,869 3,394 7,008 19,017 18,671
Week ending
September 18, September 25,
2010
2010
(1,000 eggs)
(1,000 eggs)
29,442 23,158
3,874 1,099 29,626 7,290 3,440 6,876 18,701 18,433
30,290 23,851
4,044 1,360 32,314 8,132 3,456 7,232 17,010 19,708
Oklahoma ........................................... Pennsylvania ...................................... South Carolina .................................... Texas ................................................. Virginia ............................................... California, Missouri,
Tennessee, and West Virginia ..........
6,274 3,808 5,754 15,809 6,158
19,528
6,332 3,843 5,444 16,149 6,176
19,437
6,639 3,697 5,777 14,074 6,286
17,930
6,583 3,763 5,863 15,184 6,117
18,629
19 State total ......................................
203,522
204,208
196,342
203,536
Previous year total ..............................
195,627
193,228
187,892
193,476
Percent of previous year .....................
104
106
104
105
October 2, 2010
(1,000 eggs)
28,574 23,294
3,952 1,358 30,648 7,306 3,098 7,450 17,709 19,116
6,336 3,694 5,288 15,474 5,769
18,424
197,490
183,016
108
October 9, 2010
(1,000 eggs)
29,445 23,561
3,862 1,358 30,705 7,510 3,440 7,514 17,764 17,523
6,533 3,760 5,127 15,771 6,461
19,166
199,500
190,600
105
Broiler-Type Chicks Placed 19 Selected States: 2010
State
Alabama ............................................. Arkansas ............................................ Delaware ............................................ Florida ................................................ Georgia .............................................. Kentucky ............................................. Louisiana ............................................ Maryland ............................................. Mississippi .......................................... North Carolina ....................................
September 4, 2010
(1,000 chicks)
20,939 20,964
5,281 1,015 27,425 6,366 2,978 5,905 16,305 15,748
September 11, 2010
(1,000 chicks)
21,520 20,693
4,960 1,082 27,164 5,973 2,927 6,058 16,383 15,799
Week ending
September 18, September 25,
2010
2010
(1,000 chicks) (1,000 chicks)
21,402 20,527
4,780 1,084 26,654 5,568 2,969 5,606 16,134 15,745
21,250 21,175
5,136 1,092 27,731 6,764 2,974 5,237 15,031 14,320
October 2, 2010
(1,000 chicks)
20,019 20,861
4,565 1,172 27,586 6,984 2,775 6,244 16,424 14,315
October 9, 2010
(1,000 chicks)
20,119 21,087
4,668 1,105 24,761 5,900 3,039 5,542 16,017 14,279
Oklahoma ........................................... Pennsylvania ...................................... South Carolina .................................... Texas ................................................. Virginia ............................................... California, Missouri,
Tennessee, and West Virginia ..........
4,887 3,223 4,779 13,169 4,653
16,126
5,348 3,170 4,610 13,450 4,540
16,649
4,355 3,143 4,810 14,125 5,183
17,282
3,321 3,119 4,885 13,508 5,149
16,640
4,993 3,048 5,040 13,838 4,863
16,619
4,016 2,942 4,746 11,942 5,140
16,409
19 State total ......................................
169,763
170,326
169,367
167,332
169,346
161,712
Previous year total ..............................
167,105
166,413
166,623
162,040
160,413
155,860
Percent of previous year .....................
102
102
102
103
106
104
Average hatchability for chicks hatched in the 19 selected States during the week was 84 percent. Average hatchability is calculated by dividing chicks hatched during the week by eggs set three weeks earlier.