United States Department of Agriculture
GA Broiler Hatchery News Release
In Cooperation with the Georgia Department of Agriculture Georgia Field Office 355 East Hancock Avenue, Suite 320 Athens, GA 30601 (706) 546-2236
www.nass.usda.gov
May 27, 2009
Media Contact: Douglas G. Kleweno nass-ga@nass.usda.gov
BROILERS PLACED IN GEORGIA DOWN 8 PERCENT BROILER EGGS SET DOWN 8 PERCENT
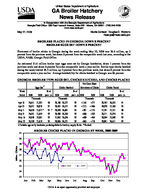
Placement of broiler chicks in Georgia during the week ending May 23, 2009 was 26.6 million, up 3 percent from the previous week, but down 8 percent from the comparable week last year, according to the USDA, NASS, Georgia Field Office.
An estimated 31.6 million broiler type eggs were set by Georgia hatcheries, down 1 percent from the previous week and down 8 percent from the comparable week a year earlier. Broiler-type chicks hatched during the week totaled 26.5 million, up 2 percent from the previous week, but down 8 percent from the comparable week a year earlier. Average hatchability for chicks hatched in Georgia was 84 percent.
GEORGIA BROILER TYPE EGGS SET, CHICKS HATCHED, AND CHICKS PLACED
Eggs Set1/
Chicks Hatched
Net Cross State Movement of Chicks
Chicks Placed
Week
% of
% of
% of
Ended 2008 2009 prev. yr. 2008 2009 prev. yr. 2008 2009 2008 2009 prev. yr.
Thousands
Thousands
Thousands
Thousands
Apr 18 34,651 31,283 90 28,188 26,237 93 +1165 +377 28,783 26,052 91
Apr 25 34,021 30,878 91 28,407 26,557 93 +1215 +1466 29,038 27,560 95
May 2 34,630 31,673 * 91 * 28,029 26,691 95 +381 +1125 27,781 27,251 98
May 9 34,041 31,659 93 28,488 26,300 92 +686 +203 28,571 25,974 91
May 16 34,848 32,085 92 27,963 26,026 93 +689 +464 28,094 25,848 92
May 23 34,509 31,618 92 28,806 26,531 92 +865 +718 28,981 26,611 92
1/ Includes eggs set by hatcheries producing chicks for hatchery supply flocks. * Revised.
BROILER CHICKS PLACED IN GEORGIA BY WEEK, 2008-2009
31
30
29
28
27
26
25
2008
2009
24
23 Jan Feb Mar Apr
May Jun Jul
Aug Sep
Oct Nov Dec
Million Chicks
USDA is an equal opportunity provider and employer.
State
AL AR DE FL GA KY LA MD MS NC OK PA SC TX VA CA, MO, TN, & WV
19 State Total
Previous Year Total
Pct. of Prev. Year * Revised
State
AL AR DE FL GA KY LA MD MS NC OK PA SC TX VA CA, MO, TN, & WV
19 State Total
Previous Year Total
Pct. of Prev. Year * Revised
Broiler-Type Eggs Set, 19 Selected States
Week Ending
Apr 18 2009
Apr 25 2009
May 2 2009
May 9 2009
Thousand
Thousand
Thousand
Thousand
29,935 23,995 3,585
991 31,283 7,704 2,230 9,160 17,622 18,936 6,921 3,952 5,538 15,351 6,179 *19,708
29,465 23,797 3,529
991 30,878 7,552 2,230 8,963 17,849 18,449 7,047 4,061 5,636 14,980 6,236 19,623
*29,533 *23,739
3,615 994
*31,673 7,699 2,230 8,799
*17,456 *18,629 *7,002
3,805 5,714 14,500 6,283 19,319
29,705 23,447 3,579
995 31,659 7,739 2,230 8,700 17,996 18,831 6,779 *4,182 5,905 15,134 6,381 *19,913
*203,090
201,286
*200,990
*203,175
215,758
214,262
214,943
215,106
94
94
94
94
May 16 2009
Thousand
29,867 24,049 3,760
992 32,085 7,589 2,230 8,803 18,587 18,388 6,667 *3,667 5,629 15,363 6,401 *19,996
*204,073
218,063
94
May 23 2009
Thousand
29,892 24,116 3,616
992 31,618 7,930 2,245 8,870 18,372 18,368 6,683 3,950 5,594 15,501 6,226 19,906
203,879
217,208
94
Broiler Chicks Placed, 19 Selected States
Week Ending
Apr 18 2009
Apr 25 2009
May 2 2009
May 9 2009
Thousand
Thousand
Thousand
Thousand
*20,393 20,538 4,370
726 26,052 5,970 1,901 6,661 16,491 15,666 4,530 2,879 4,728 13,415 4,987 17,339
19,724 21,929 4,758
685 27,560 5,869 1,896 5,637 16,899 15,836 4,601 3,168 4,257 13,341 5,475 17,736
*20,352 21,156 5,033
695 27,251 6,067 1,902 6,088 16,693 15,639 4,931 3,105 4,768 13,001 4,562 16,713
21,024 21,626 4,850
821 25,974 6,769 1,888 6,451 16,072 15,659 4,417 *3,098 5,862 13,340 4,996 *16,605
*166,646
169,371
*167,956
*169,452
177,032
178,663
178,080
177,253
94
95
94
96
May 16 2009
Thousand
*20,755 *21,171
5,346 870
25,848 5,968 1,902 5,834 16,311 *15,284 4,701 *3,095 5,019 12,991 5,129 *17,378
*167,602
175,827
95
May 23 2009
Thousand
20,860 21,879 5,168
718 26,611 6,468 1,917 5,448 15,625 15,475 3,938 3,025 5,085 12,618 5,380 16,735
166,950
177,324
94
Average hatchability for chicks hatched in the 19 selected States during the week was 85 percent Average hatchability is calculated by dividing chicks hatched during the week by eggs set three weeks earlier.
