- Collection:
- Georgia Government Publications
- Serial:
- Broiler hatchery news release / United States Department of Agriculture National Agricultural Statistics Service.
- Title:
- Georgia broiler hatchery news release, 2008 June 4
- Creator:
- Georgia Crop Reporting Service
- Contributor to Resource:
- United States. National Agricultural Statistics Service. Southern Regional Field Office, issuing body.
Alabama. Department of Agriculture and Industries, issuing body.
Florida. Department of Agriculture and Consumer Services, issuing body.
Georgia. Department of Agriculture, issuing body.
South Carolina. Department of Agriculture, issuing body. - Publisher:
- Athens, Ga. : Georgia Agricultural Statistics Service
- Date of Original:
- 2008-06-04
- Subject:
- Poultry--Hatcheries--Georgia--Statistics
Eggs--Production--Georgia--Statistics - Location:
- United States, Georgia, 32.75042, -83.50018
- Medium:
- state government records
- Type:
- Text
- Format:
- application/pdf
- Description:
- Began with: August 28, 2013.
Effective March 12, 2014, name of issuing body appears as Southern Regional Field Office.
August 28, 2013; title from caption (Georgia Government Publications database, viewed January 19, 2018).
January 17, 2018 (received via e-mail on January 18, 2018 from Georgia Department of Agriculture); (Georgia Government Publications database, viewed November 22, 2017). - External Identifiers:
- Call Number GA A400.C7 P1 H2 2008/6-4
- Metadata URL:
- https://dlg.galileo.usg.edu/id:dlg_ggpd_i-ga-ba400-pc7-bp1-bh2-b2008-s6-h4-belec-p-btext
- Digital Object URL:
- https://dlg.galileo.usg.edu/do:dlg_ggpd_i-ga-ba400-pc7-bp1-bh2-b2008-s6-h4-belec-p-btext
- Language:
- eng
- Holding Institution:
- University of Georgia. Map and Government Information Library
- Rights:
-

United States Department of Agriculture
GA Broiler Hatchery News Release
In Cooperation with the Georgia Department of Agriculture Georgia Field Office 355 East Hancock Avenue, Suite 320 Athens, GA 30601 (706) 546-2236
www.nass.usda.gov
June 4, 2008
Media Contact: Douglas G. Kleweno nass-ga@nass.usda.gov
BROILERS PLACED IN GEORGIA DOWN 1 PERCENT BROILER EGGS SET DOWN 4 PERCENT
Placement of broiler chicks in Georgia during the week ending May 31, 2008 was 28.6 million, down 1 percent from the previous week and down 1 percent from the comparable week last year, according to the USDA, NASS, Georgia Field Office.
An estimated 34.0 million broiler type eggs were set by Georgia hatcheries, down 1 percent from the previous week and down 4 percent from the comparable week a year earlier. Broiler-type chicks hatched during the week totaled 28.3 million, down 2 percent from the previous week and down 2 percent from the comparable week a year earlier. Average hatchability for chicks hatched in Georgia was 83 percent.
GEORGIA BROILER TYPE EGGS SET, CHICKS HATCHED, AND CHICKS PLACED
Eggs Set1/
Chicks Hatched
Net Cross State Movement of Chicks
Chicks Placed
Week
% of
% of
% of
Ended 20072/ 2008 prev. yr. 20072/ 2008 prev. yr. 20072/ 2008 20072/ 2008 prev. yr.
Thousands
Thousands
Apr 26 35,682 34,021 * 95 29,292 28,407
Thousands 97 +573 +1215
Thousands 29,255 29,038 99
May 3 35,138 34,630 99 29,403 28,029 95 +521 +381 29,257 27,781 95
May 10 35,292 34,041 * 96 29,368 28,488 97 +538 +686 29,271 28,571 98
May 17 35,585 34,854 98 29,231 27,963 96 -742 +689 27,791 28,094 101
May 24 35,594 34,509 * 97 28,924 28,806 * 100 * +1272 +865 * 29,534 28,981 * 98 *
May 31 35,439 34,004 96 28,975 28,330 98 +481 +848 28,933 28,628 99 1/ Includes eggs set by hatcheries producing chicks for hatchery supply flocks. 2/ All 2007 revised. * Revised.
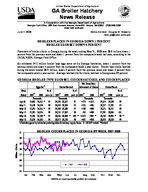
Million Chicks
31 30 29 28 27 26 25 24
Jan
BROILER CHICKS PLACED IN GEORGIA BY WEEK, 2007-2008
2007
2008
Feb Mar Apr May Jun Jul Aug Sep Oct Nov Dec
USDA is an equal opportunity provider and employer.
State
AL AR DE FL GA KY LA MD MS NC OK PA SC TX VA CA, MO, TN, & WV
19 State Total
Previous Year Total
Pct. of Prev. Year * Revised
Broiler-Type Eggs Set, 19 Selected States Week Ending
Apr 26 2008
May 3 2008
May 10 2008
May 17 2008
Thousand
Thousand
Thousand
Thousand
32,212 27,071 3,721 1,331 *34,021 *7,249 3,712 8,223 18,999 19,475 *6,791 4,193 5,420 15,346 6,211 19,700
31,637 27,317 3,721 1,346 34,630 *8,102 3,712 8,812 18,266 19,314 *7,215 4,231 5,371 14,656 6,444 19,641
31,858 26,611 3,718 1,336 *34,041 *8,159 3,712 8,840 18,893 *19,740 *7,446 *4,232 5,491 14,846 5,939 19,640
32,089 27,150 3,728 1,331 34,854 8,125 3,650 8,796 19,060 19,711 *7,399 *4,405 5,718 15,477 6,429 *19,889
*213,675
*214,415
*214,502
*217,811
218,515
218,353
219,938
219,928
98
98
98
99
May 24 2008
Thousand
*31,905 27,244 3,717 1,336 *34,509 *8,213 3,682 8,771 18,948 *19,587 *7,301 *4,442 5,556 15,495 6,257 *19,723
*216,686
219,527
99
May 31 2008
Thousand
32,156 27,138 3,721 1,346 34,004 8,154 3,620 8,601 18,981 19,577 7,204 4,523 5,490 15,609 6,242 20,114
216,480
218,990
99
State
AL AR DE FL GA KY LA MD MS NC OK PA SC TX VA CA, MO, TN, & WV
19 State Total
Previous Year Total
Pct. of Prev. Year * Revised
Broiler Chicks Placed, 19 Selected States Week Ending
Apr 26 2008
May 3 2008
May 10 2008
May 17 2008
Thousand
Thousand
Thousand
Thousand
20,738 *23,338
4,584 1,255 29,038 6,793 3,344 7,121 17,359 16,128 *5,214 3,254 4,434 12,730 4,767 18,143
21,475 *23,995
4,851 1,145 27,781 6,730 3,784 6,258 17,060 16,510 *4,445 3,234 5,151 13,324 4,948 17,050
21,111 *22,615
5,746 1,271 28,571 6,246 3,147 6,021 17,145 16,014 5,430 *3,262 4,812 12,709 4,077 18,442
21,200 *22,940
4,321 1,138 28,094 *5,431 3,634 5,712 17,383 16,120 5,136 *3,254 4,997 12,859 5,113 18,014
*178,240
*177,741
*176,619
*175,346
180,188
180,084
180,594
178,545
99
99
98
98
May 24 2008
Thousand
*21,782 *25,035
4,949 1,136 *28,981 *6,177 3,474 6,008 *16,614 *16,087 *3,883 *3,261 4,618 12,535 4,976 *17,271
*176,787
179,069
99
May 31 2008
Thousand
20,382 23,736 5,206 1,383 28,628 6,117 3,683 5,602 17,259 16,076 4,608 3,220 4,756 12,424 4,858 17,632
175,570
180,055
98
Average hatchability for chicks hatched in the 19 selected States during the week was 84 percent Average hatchability is calculated by dividing chicks hatched during the week by eggs set three weeks earlier.