United States Department of Agriculture
GA Broiler Hatchery News Release
In Cooperation with the Georgia Department of Agriculture Georgia Field Office 355 East Hancock Avenue, Suite 320 Athens, GA 30601 (706) 546-2236
www.nass.usda.gov
May 21, 2008
Media Contact: Douglas G. Kleweno nass-ga@nass.usda.gov
BROILERS PLACED IN GEORGIA UP 1 PERCENT BROILER EGGS SET DOWN 2 PERCENT
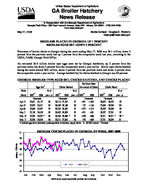
Placement of broiler chicks in Georgia during the week ending May 17, 2008 was 28.1 million, down 2 percent from the previous week, but up 1 percent from the comparable week last year, according to the USDA, NASS, Georgia Field Office.
An estimated 34.9 million broiler type eggs were set by Georgia hatcheries, up 2 percent from the previous week, but down 2 percent from the comparable week a year earlier. Broiler-type chicks hatched during the week totaled 28.0 million, down 2 percent from the previous week and down 4 percent from the comparable week a year earlier. Average hatchability for chicks hatched in Georgia was 82 percent.
GEORGIA BROILER TYPE EGGS SET, CHICKS HATCHED, AND CHICKS PLACED
Eggs Set1/
Chicks Hatched
Net Cross State Movement of Chicks
Chicks Placed
Week Ended
Apr 12
20072/ 2008 Thousands
35,641 34,137
% of prev. yr.
96
20072/ 2008 Thousands
28,716 27,764
% of prev. yr. 20072/ 2008
Thousands 97 +441 +1063
20072/ 2008 Thousands
28,653 28,232
% of prev. yr.
99
Apr 19 35,923 34,651 96 28,440 28,188 99 -157 +1166 27,694 28,784 104
Apr 26 35,682 33,997 95 29,292 28,407 97 +573 +1215 29,255 29,038 99
May 3 35,138 34,630 99 29,403 28,029 95 +521 +381 29,257 27,781 95
May 10 35,292 34,053 * 96 29,368 28,488 * 97 +538 +686 29,271 28,571 * 98 *
May 17 35,585 34,854 98 29,231 27,963 96 -742 +689 27,791 28,094 101 1/ Includes eggs set by hatcheries producing chicks for hatchery supply flocks. 2/ All 2007 revised. * Revised
Million Chicks
31 30 29 28 27 26 25 24
Jan
BROILER CHICKS PLACED IN GEORGIA BY WEEK, 2007-2008
2007
2008
Feb Mar Apr May Jun Jul Aug Sep Oct Nov Dec
USDA is an equal opportunity provider and employer.
State
AL AR DE FL GA KY LA MD MS NC OK PA SC TX VA CA, MO, TN, & WV
19 State Total
Previous Year Total
Pct. of Prev. Year * Revised
Broiler-Type Eggs Set, 19 Selected States Week Ending
Apr 12 2008
Apr 19 2008
Apr 26 2008
May 3 2008
Thousand
Thousand
Thousand
Thousand
31,687 27,171 4,027 1,413 34,137 7,899 3,712 8,779 18,879 19,617 6,580 4,318 5,611 15,588 6,174 20,333
31,966 26,532 3,942 1,327 34,651 7,925 3,712 8,995 18,877 19,533 *6,578 4,400 5,554 15,076 5,791 19,966
*32,212 27,071 3,721 *1,331 33,997 *7,255 3,712 8,223 18,999 *19,475 *6,353 4,193 5,420 15,346 6,211 *19,700
31,637 27,317 3,721 1,346 34,630 8,034 3,712 8,812 18,266 19,355 6,655 4,188 5,371 14,656 6,369 *19,641
215,925
*214,825
*213,219
*213,710
219,385
220,515
218,515
218,353
98
97
98
98
May 10 2008
Thousand
31,858 *26,611
3,718 1,336 *34,053 8,124 3,712 8,840 18,893 *19,631 *6,782 *4,323 5,491 14,846 5,939 *19,640
*213,797
219,938
97
May 17 2008
Thousand
32,089 27,150 3,726 1,331 34,854 8,125 3,650 8,791 19,060 19,711 6,859 4,266 5,718 15,477 6,427 20,205
217,439
219,928
99
State
AL AR DE FL GA KY LA MD MS NC OK PA SC TX VA CA, MO, TN, & WV
19 State Total
Previous Year Total
Pct. of Prev. Year * Revised
Broiler Chicks Placed, 19 Selected States Week Ending
Apr 12 2008
Apr 19 2008
Apr 26 2008
May 3 2008
Thousand
Thousand
Thousand
Thousand
21,303 23,233 4,804 1,333 28,232 *5,953 3,726 6,095 17,375 15,997 5,632 *3,352 4,776 13,022 5,720 17,060
21,674 22,047 4,867 1,191 28,784 *6,467 3,607 6,590 17,291 15,649 4,964 *3,277 4,418 13,108 5,021 18,201
20,738 23,316 4,584 1,255 29,038 *6,793 3,344 7,121 17,359 16,128 5,213 *3,254 4,434 12,730 4,767 18,143
21,475 23,873 4,851 1,145 27,781 6,730 3,784 6,258 17,060 16,510 4,447 *3,243 5,151 13,324 4,860 *17,050
*177,613
*177,156
*178,217
*177,542
177,312
177,686
180,188
180,084
100
100
99
99
May 10 2008
Thousand
21,111 *22,589
5,746 1,271 *28,571 6,248 3,147 6,021 17,145 *16,014 5,430 *3,272 4,812 12,709 4,077 *18,442
*176,605
180,594
98
May 17 2008
Thousand
21,200 22,624 4,625 1,138 28,094 5,434 3,634 5,337 17,383 16,120 5,395 3,318 4,997 12,859 5,302 18,014
175,474
178,545
98
Average hatchability for chicks hatched in the 19 selected States during the week was 83 percent. Average hatchability is calculated by dividing chicks hatched during the week by eggs set three weeks earlier.
