- Collection:
- Georgia Government Publications
- Serial:
- Broiler hatchery news release / United States Department of Agriculture National Agricultural Statistics Service.
- Title:
- Georgia broiler hatchery news release, 2008 April 30
- Creator:
- Georgia Crop Reporting Service
- Contributor to Resource:
- United States. National Agricultural Statistics Service. Southern Regional Field Office, issuing body.
Alabama. Department of Agriculture and Industries, issuing body.
Florida. Department of Agriculture and Consumer Services, issuing body.
Georgia. Department of Agriculture, issuing body.
South Carolina. Department of Agriculture, issuing body. - Publisher:
- Athens, Ga. : Georgia Agricultural Statistics Service
- Date of Original:
- 2008-04-30
- Subject:
- Poultry--Hatcheries--Georgia--Statistics
Eggs--Production--Georgia--Statistics - Location:
- United States, Georgia, 32.75042, -83.50018
- Medium:
- state government records
- Type:
- Text
- Format:
- application/pdf
- Description:
- Began with: August 28, 2013.
Effective March 12, 2014, name of issuing body appears as Southern Regional Field Office.
August 28, 2013; title from caption (Georgia Government Publications database, viewed January 19, 2018).
January 17, 2018 (received via e-mail on January 18, 2018 from Georgia Department of Agriculture); (Georgia Government Publications database, viewed November 22, 2017). - External Identifiers:
- Call Number GA A400.C7 P1 H2 2008/4-30
- Metadata URL:
- https://dlg.galileo.usg.edu/id:dlg_ggpd_i-ga-ba400-pc7-bp1-bh2-b2008-s4-h30-belec-p-btext
- Digital Object URL:
- https://dlg.galileo.usg.edu/do:dlg_ggpd_i-ga-ba400-pc7-bp1-bh2-b2008-s4-h30-belec-p-btext
- Language:
- eng
- Holding Institution:
- University of Georgia. Map and Government Information Library
- Rights:
-

United States Department of Agriculture
GA Broiler Hatchery News Release
In Cooperation with the Georgia Department of Agriculture Georgia Field Office 355 East Hancock Avenue, Suite 320 Athens, GA 30601 (706) 546-2236
www.nass.usda.gov
April 30, 2008
Media Contact: Douglas G. Kleweno nass-ga@nass.usda.gov
BROILERS PLACED IN GEORGIA DOWN 1 PERCENT BROILER EGGS SET DOWN 5 PERCENT
Placement of broiler chicks in Georgia during the week ending April 26, 2008 was 29.0 million, up 1 percent from the previous week, but down 1 percent from the comparable week last year, according to the USDA, NASS, Georgia Field Office.
An estimated 34.0 million broiler type eggs were set by Georgia hatcheries, down 2 percent from the previous week and down 5 percent from the comparable week a year earlier. Broiler-type chicks hatched during the week totaled 28.4 million, up 1 percent from the previous week, but down 3 percent from the comparable week a year earlier. Average hatchability for chicks hatched in Georgia was 81 percent.
GEORGIA BROILER TYPE EGGS SET, CHICKS HATCHED, AND CHICKS PLACED
Eggs Set1/
Chicks Hatched
Net Cross State Movement of Chicks
Chicks Placed
Week Ended
Mar 22
20072/ 2008 Thousands
35,062 34,426
% of prev. yr.
98
20072/ 2008 Thousands
28,493 28,689
% of prev. yr. 20072/ 2008
Thousands 101 +546 +1522
20072/ 2008 Thousands
28,426 29,748
% of prev. yr.
105
Mar 29 34,629 34,663 100 28,402 28,853 102 +304 +715 28,109 28,943 103
Apr 5 35,553 34,911 98 28,666 28,814 101 +358 +682 28,377 28,899 102
Apr 12 35,641 34,137 96 28,716 27,764 97 +441 +1063 28,653 28,232 99
Apr 19 35,923 34,651 96 28,440 28,188 99 -157 +1166 * 27,694 28,784 * 104
Apr 26 35,682 33,997 95 29,292 28,407 97 +573 +1215 29,255 29,038 99 1/ Includes eggs set by hatcheries producing chicks for hatchery supply flocks. 2/ All 2007 revised. * Revised.
Million Chicks
31
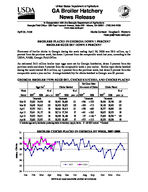
BROILER CHICKS PLACED IN GEORGIA BY WEEK, 2007-2008
30
29
28
27
26
25
2007
2008
24 Jan Feb Mar Apr
May Jun Jul
Aug Sep
Oct Nov Dec
USDA is an equal opportunity provider and employer.
State
AL AR DE FL GA KY LA MD MS NC OK PA SC TX VA CA, MO, TN, & WV
19 State Total
Previous Year Total
Pct. of Prev. Year * Revised
State
AL AR DE FL GA KY LA MD MS NC OK PA SC TX VA CA, MO, TN, & WV
19 State Total
Previous Year Total
Pct. of Prev. Year * Revised
Broiler-Type Eggs Set, 19 Selected States
Week Ending
Mar 22 2008
Mar 29 2008
Apr 5 2008
Apr 12 2008
Thousand
Thousand
Thousand
Thousand
31,727 27,080 3,957 1,414 34,426 7,718 3,712 8,831 19,164 *19,409 6,497 4,294 5,726 15,531 6,621 19,743
*31,597 26,038 4,065 1,419 34,663 8,111 3,712 8,939 18,863 19,419 6,135 4,290 5,436 15,732 6,350 19,890
*31,799 *26,966
4,090 1,413 34,911 *8,042 3,937 9,106 18,926 *19,609 6,368 4,265 *5,391 15,683 6,269 20,139
*31,838 27,171 4,027 1,413 34,137 7,902 3,712 8,779 19,242 *19,589 6,580 4,198 5,611 15,574 6,416 20,224
*215,850
*214,659
*216,914
*216,413
215,509
216,513
218,877
219,385
100
99
99
99
Apr 19 2008
Thousand
*31,928 *27,408
3,942 1,327 34,651 7,702 3,712 8,995 18,877 19,587 *6,682 *4,349 5,406 15,063 6,164 *20,107
*215,900
220,515
98
Apr 26 2008
Thousand
32,248 27,071 3,721 1,306 33,997 7,391 3,712 8,223 18,999 19,714 6,252 4,217 5,420 15,333 6,211 19,413
213,228
218,515
98
Broiler Chicks Placed, 19 Selected States Week Ending
Mar 22 2008
Mar 29 2008
Apr 5 2008
Apr 12 2008
Thousand
Thousand
Thousand
Thousand
21,579 23,727 5,191 1,305 29,748 6,165 3,883 5,989 17,307 16,344 4,613 3,240 4,438 13,719 5,149 *18,694
22,103 23,655 5,203 1,353 28,943 5,929 3,730 5,561 17,262 16,196 4,913 3,215 4,877 13,573 5,448 *18,309
21,853 *23,914
4,902 1,291 28,899 6,229 3,715 6,917 17,340 16,072 5,173 3,435 5,159 13,109 5,069 17,846
*21,303 23,233 4,804 1,333 28,232 6,054 3,726 6,095 17,375 *15,997 5,632 3,352 4,776 13,010 5,720 17,035
*181,091
*180,270
*180,923
*177,677
176,045
176,014
177,141
177,312
103
102
102
100
Apr 19 2008
Thousand
*21,674 *22,047
4,867 1,191 *28,784 *6,589 3,607 6,590 17,291 15,649 4,964 *3,323 4,418 13,097 5,021 *18,143
Apr 26 2008
Thousand
20,738 23,230 4,584 1,255 29,038 6,683 3,344 7,121 17,359 16,118 5,213 3,340 4,434 12,719 4,767 18,165
*177,255 178,108
177,686 180,188
100
99
Average hatchability for chicks hatched in the 19 selected States during the week was 83 percent. Average hatchability is calculated by dividing chicks hatched during the week by eggs set three weeks earlier.