- Collection:
- Georgia Government Publications
- Serial:
- Broiler hatchery news release / United States Department of Agriculture National Agricultural Statistics Service.
- Title:
- Georgia weekly hatchery, 1998 October 28
- Creator:
- Georgia Crop Reporting Service
- Contributor to Resource:
- United States. National Agricultural Statistics Service. Southern Regional Field Office, issuing body.
Alabama. Department of Agriculture and Industries, issuing body.
Florida. Department of Agriculture and Consumer Services, issuing body.
Georgia. Department of Agriculture, issuing body.
South Carolina. Department of Agriculture, issuing body. - Publisher:
- Athens, Ga. : Georgia Agricultural Statistics Service
- Date of Original:
- 1998-10-28
- Subject:
- Poultry--Hatcheries--Georgia--Statistics
Eggs--Production--Georgia--Statistics - Location:
- United States, Georgia, 32.75042, -83.50018
- Medium:
- state government records
- Type:
- Text
- Format:
- application/pdf
- Description:
- Began with: August 28, 2013.
Effective March 12, 2014, name of issuing body appears as Southern Regional Field Office.
August 28, 2013; title from caption (Georgia Government Publications database, viewed January 19, 2018).
January 17, 2018 (received via e-mail on January 18, 2018 from Georgia Department of Agriculture); (Georgia Government Publications database, viewed November 22, 2017). - External Identifiers:
- Call Number GA A400.C7 P1 H2 1998/10-28
- Metadata URL:
- https://dlg.galileo.usg.edu/id:dlg_ggpd_i-ga-ba400-pc7-bp1-bh2-b1998-s10-h28
- Digital Object URL:
- https://dlg.galileo.usg.edu/do:dlg_ggpd_i-ga-ba400-pc7-bp1-bh2-b1998-s10-h28
- Language:
- eng
- Holding Institution:
- University of Georgia. Map and Government Information Library
- Rights:
-

iJt\
AP4l011=.C1==============================
~~110,nGEORGIA WEEKLY HATCHERY
Released: October 28, 1998
Publication No. USPS 383-930
AGRICULTURAL STATISTICS SERVICE
Stephens Federal Building Suite 320 Athens, Georgia 30601 Phone: (706)546-2236
948-43
We want to get our releases to you more quickly! To do this, we will begin E-mail or Fax delivery to as many subscribers as possible. Please let us know our E-mail or Fax number and we will be n aster delive o the releases ou have re uested.
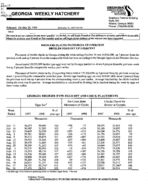
BROILERS PLACED IN GEORGIA UP 5 PERCENT BROILER EGGS SET UP 5 PERCENT
Placement of broiler chicks in Georgia during the week ending October 24 was 24,924,000, up 7 percent from the previous week and up 5 percent from the comparable week last year, according to the Georgia Agricultural Statistics Service.
An estimated 28,933,000 broiler type eggs were set by Georgia hatcheries, down 4 percent from the previous week but up 5 percent from the comparable week a year earlier.
Placement of broiler chicks in the 15 reporting States totaled 137,456,000, up 5 percent from the previous week but down 1 percent from the comparable week last year. Broiler type hatching eggs set were 163,841,000, down 2 percent from the previous week but up 4 percent from the corresponding week a year earlier. Average hatchability for chicks hatched during the week was 81 percent. Average hatchability is calculated by dividing chicks hatched during the week by eggs set three weeks earlier.
Week Ended
GEORGIA BROILER TYPE EGGS SET AND CHICK PLACEMENTS
Eggs Set11
Net Cross State Movement of Chicks
Chicks Placed for Broiler in Georgia
1997
1998
%of year ago
Thousands
1997
1998
Thousands
1997
1998
Thousands
%of year ago
July 11
30,673
30,664
100
-358
July 18
30,585
31,283
102
+7
July 25
29,649
31,059
105
+355
Aug. 1
29,781
30,941
104
-206
Aug. 8
30,512
30,879
101
+309
Aug. 15
29,543
31,044
105
-157
Aug. 22
30,478
31,603
104
-335
Aug. 29
30,359
31,242
103
-176
Sept. 5
30,376
30,914
102
-16
Sept. 12
28,323
30,196
107
+132
Sept. 19
28,506
30,386
107
+205
Sept. 26
28,068
29,566
105
+207
Oct. 3
30,269
31,368
104
-29
Oct. 10
28,914
31,151
108
-142
Oct. 17
26,729
30,243*
113
-73
Oct. 24
27 470
28 933
105
-312
l/ Includes eggs set by hatcheries producing chicks for hatchery supply flocks. * Revised
-72 +154 +313 +115 +607 +304 -461 +82 -334 +307 +404 +736 +428 +137 +379 +474
24,053 24,180 24,024 24,198 24,555 23,454 23,208 24,060 23,574 24,196 24,262 24,496 22,561 22,520 22,017 23 740
24,443
102
24,893
103
24,376
101
24,033
99
25,010
102
24,657
105
23,577
102
23,073
100
23,898
101
24,926
103
24,797
102
24,685
101
23,971
106
23,612
105
23,366*
106
24924
105
Published: Weekly USDA/NASS COOPERATING WITH THE GEORGIA DEPARTMENT OF AGRICULTURE
iJt\
AP4l011=.C1==============================
~~110,nGEORGIA WEEKLY HATCHERY
Released: October 28, 1998
Publication No. USPS 383-930
AGRICULTURAL STATISTICS SERVICE
Stephens Federal Building Suite 320 Athens, Georgia 30601 Phone: (706)546-2236
948-43
We want to get our releases to you more quickly! To do this, we will begin E-mail or Fax delivery to as many subscribers as possible. Please let us know our E-mail or Fax number and we will be n aster delive o the releases ou have re uested.
BROILERS PLACED IN GEORGIA UP 5 PERCENT BROILER EGGS SET UP 5 PERCENT
Placement of broiler chicks in Georgia during the week ending October 24 was 24,924,000, up 7 percent from the previous week and up 5 percent from the comparable week last year, according to the Georgia Agricultural Statistics Service.
An estimated 28,933,000 broiler type eggs were set by Georgia hatcheries, down 4 percent from the previous week but up 5 percent from the comparable week a year earlier.
Placement of broiler chicks in the 15 reporting States totaled 137,456,000, up 5 percent from the previous week but down 1 percent from the comparable week last year. Broiler type hatching eggs set were 163,841,000, down 2 percent from the previous week but up 4 percent from the corresponding week a year earlier. Average hatchability for chicks hatched during the week was 81 percent. Average hatchability is calculated by dividing chicks hatched during the week by eggs set three weeks earlier.
Week Ended
GEORGIA BROILER TYPE EGGS SET AND CHICK PLACEMENTS
Eggs Set11
Net Cross State Movement of Chicks
Chicks Placed for Broiler in Georgia
1997
1998
%of year ago
Thousands
1997
1998
Thousands
1997
1998
Thousands
%of year ago
July 11
30,673
30,664
100
-358
July 18
30,585
31,283
102
+7
July 25
29,649
31,059
105
+355
Aug. 1
29,781
30,941
104
-206
Aug. 8
30,512
30,879
101
+309
Aug. 15
29,543
31,044
105
-157
Aug. 22
30,478
31,603
104
-335
Aug. 29
30,359
31,242
103
-176
Sept. 5
30,376
30,914
102
-16
Sept. 12
28,323
30,196
107
+132
Sept. 19
28,506
30,386
107
+205
Sept. 26
28,068
29,566
105
+207
Oct. 3
30,269
31,368
104
-29
Oct. 10
28,914
31,151
108
-142
Oct. 17
26,729
30,243*
113
-73
Oct. 24
27 470
28 933
105
-312
l/ Includes eggs set by hatcheries producing chicks for hatchery supply flocks. * Revised
-72 +154 +313 +115 +607 +304 -461 +82 -334 +307 +404 +736 +428 +137 +379 +474
24,053 24,180 24,024 24,198 24,555 23,454 23,208 24,060 23,574 24,196 24,262 24,496 22,561 22,520 22,017 23 740
24,443
102
24,893
103
24,376
101
24,033
99
25,010
102
24,657
105
23,577
102
23,073
100
23,898
101
24,926
103
24,797
102
24,685
101
23,971
106
23,612
105
23,366*
106
24924
105
Published: Weekly USDA/NASS COOPERATING WITH THE GEORGIA DEPARTMENT OF AGRICULTURE
State
AL AR DE FL GA MD MS NC PA SC TX VA CA,TN,&WV
15 State Total
Previous Year Total
Pct. of Prev. Year *Revised.
Sep 19 1998
Thousand
25,634 28,468
3,837 2,546 30,386 8,515 16,055 15,215 3,491 4,470 12,609 5,989 9,116
166,331
164,036
101
Broiler Eggs Set, 15 Selected States
Week Ending
Sep26 1998
Oct3 1998
Oct 10 1998
Thousand
Thousand
Thousand
25,561 *27,963
4,344 2,792 29,566 8,714 16,360 15,702 3,788 4,444 11,988 6,012 10,196
25,471 *29,312
4,378 2,736 31,368 8,587 *16,831 *16,081 3,556 4,585 13,278 6,588 10,455
23,968 28,662 4,095
2,510 31,151
8,725 17,624 15,988 3,607 4,498 12,776 6,104 10,725
*167,430
*173,226
170,433
162,951
170,663
165,123
103
102
103
Oct 17 1998
Thousand
24,355 28,113 4,098
2,461 *30,243
7,697 16,423 15,659 *3,274 4,548 12,737 *6,172 *11,389
*167,169
158,883
105
Oct24 1998
Thousand
24,756 27,796 4,068
2,826 28,933
7,806 15,907 15,663 3,322 4,276 11,932 6,039 10,517
163,841
157,305
104
State
AL AR DE FL GA MD MS NC PA SC TX VA CA,TN,&WV
15 State Total
Previous Year Total
Pct. of Prev. Year *Revised.
Sep 19 1998
Thousand
18,443 22,447
5,194 2,588 24,797 6,326 14,537 13,051 2,724 *3,114 9,882 5,285 9,677
Broiler Chicks Placed, 15 Selected States
Week Ending
Sep 26 1998
Oct3 1998
Oct 10 1998
Thousand
19,480 22,558
5,546 2,036 24,685 5,227 14,728 12,557 2,692 *3,033 9,652 5,009 8,726
Thousand
18,058 21,391
5,756 1,918 23,971 4,834 14,114 12,557 2,438 *3,670 9,682 4,883 8,496
Thousand
18,729 22,704
4,535 2,307 23,612 5,361 13,191 *11,901 2,346 *3,798 9,340 4,914 7,997
*138,065
*135,929
*131,768
*130,735
137,962
136,917
129,607
131,158
100
99
102
100
Oct 17 1998
Thousand
18,247 21,943
4,517 2,629 *23,366 6,334 13,530 12,162 *2,576 *3,051 9,344 *4,608 8,872
*131,179
130,236
101
Oct24 1998
Thousand
17,836 23,382
4,980 2,574 24,924 6,108 13,898 12,733 2,630 3,565 10,217 5,042 9,567
137,456
139,492
99
State
AL AR DE FL GA MD MS NC PA SC TX VA CA,TN,&WV
15 State Total
Previous Year Total
Pct. of Prev. Year *Revised.
Sep 19 1998
Thousand
25,634 28,468
3,837 2,546 30,386 8,515 16,055 15,215 3,491 4,470 12,609 5,989 9,116
166,331
164,036
101
Broiler Eggs Set, 15 Selected States
Week Ending
Sep26 1998
Oct3 1998
Oct 10 1998
Thousand
Thousand
Thousand
25,561 *27,963
4,344 2,792 29,566 8,714 16,360 15,702 3,788 4,444 11,988 6,012 10,196
25,471 *29,312
4,378 2,736 31,368 8,587 *16,831 *16,081 3,556 4,585 13,278 6,588 10,455
23,968 28,662 4,095
2,510 31,151
8,725 17,624 15,988 3,607 4,498 12,776 6,104 10,725
*167,430
*173,226
170,433
162,951
170,663
165,123
103
102
103
Oct 17 1998
Thousand
24,355 28,113 4,098
2,461 *30,243
7,697 16,423 15,659 *3,274 4,548 12,737 *6,172 *11,389
*167,169
158,883
105
Oct24 1998
Thousand
24,756 27,796 4,068
2,826 28,933
7,806 15,907 15,663 3,322 4,276 11,932 6,039 10,517
163,841
157,305
104
State
AL AR DE FL GA MD MS NC PA SC TX VA CA,TN,&WV
15 State Total
Previous Year Total
Pct. of Prev. Year *Revised.
Sep 19 1998
Thousand
18,443 22,447
5,194 2,588 24,797 6,326 14,537 13,051 2,724 *3,114 9,882 5,285 9,677
Broiler Chicks Placed, 15 Selected States
Week Ending
Sep 26 1998
Oct3 1998
Oct 10 1998
Thousand
19,480 22,558
5,546 2,036 24,685 5,227 14,728 12,557 2,692 *3,033 9,652 5,009 8,726
Thousand
18,058 21,391
5,756 1,918 23,971 4,834 14,114 12,557 2,438 *3,670 9,682 4,883 8,496
Thousand
18,729 22,704
4,535 2,307 23,612 5,361 13,191 *11,901 2,346 *3,798 9,340 4,914 7,997
*138,065
*135,929
*131,768
*130,735
137,962
136,917
129,607
131,158
100
99
102
100
Oct 17 1998
Thousand
18,247 21,943
4,517 2,629 *23,366 6,334 13,530 12,162 *2,576 *3,051 9,344 *4,608 8,872
*131,179
130,236
101
Oct24 1998
Thousand
17,836 23,382
4,980 2,574 24,924 6,108 13,898 12,733 2,630 3,565 10,217 5,042 9,567
137,456
139,492
99