- Collection:
- Georgia Government Publications
- Serial:
- Broiler hatchery news release / United States Department of Agriculture National Agricultural Statistics Service.
- Title:
- Georgia weekly hatchery, 1998 January 7
- Creator:
- Georgia Crop Reporting Service
- Contributor to Resource:
- United States. National Agricultural Statistics Service. Southern Regional Field Office, issuing body.
Alabama. Department of Agriculture and Industries, issuing body.
Florida. Department of Agriculture and Consumer Services, issuing body.
Georgia. Department of Agriculture, issuing body.
South Carolina. Department of Agriculture, issuing body. - Publisher:
- Athens, Ga. : Georgia Agricultural Statistics Service
- Date of Original:
- 1998-01-07
- Subject:
- Poultry--Hatcheries--Georgia--Statistics
Eggs--Production--Georgia--Statistics - Location:
- United States, Georgia, 32.75042, -83.50018
- Medium:
- state government records
- Type:
- Text
- Format:
- application/pdf
- Description:
- Began with: August 28, 2013.
Effective March 12, 2014, name of issuing body appears as Southern Regional Field Office.
August 28, 2013; title from caption (Georgia Government Publications database, viewed January 19, 2018).
January 17, 2018 (received via e-mail on January 18, 2018 from Georgia Department of Agriculture); (Georgia Government Publications database, viewed November 22, 2017). - External Identifiers:
- Call Number GA A400.C7 P1 H2 1998/1-7
- Metadata URL:
- https://dlg.galileo.usg.edu/id:dlg_ggpd_i-ga-ba400-pc7-bp1-bh2-b1998-s1-h7
- Digital Object URL:
- https://dlg.galileo.usg.edu/do:dlg_ggpd_i-ga-ba400-pc7-bp1-bh2-b1998-s1-h7
- Language:
- eng
- Holding Institution:
- University of Georgia. Map and Government Information Library
- Rights:
-

&A A40o.C7 Pl
l~~(l-'l GEORGIA WEEKLY HATCHERY
Released: January 7, 1998
Publication No. USPS 383-930
GEORGIA AGRICULTURAL STATISTICS SERVICE
Stephens Federal Building Suite 320 Athens, Georgia 30601 Phone: (706)546-2236
948-01
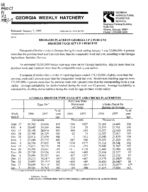
BROILERS PLACED IN GEORGIA UP 2 PERCENT BROILER EGGS SET UP 3 PERCENT
Placement of broiler chicks in Georgia during the week ending January 3 was 23,886,000--4 percent more than the previous week and 2 percent more than the comparable week last year, according to the Georgia Agricultural Statistics Service.
An estimated 30,363,000 broiler type eggs were set by Georgia hatcheries--slightly more than the previous week and 3 percent more than the comparable week a year earlier.
Placement of broiler chicks in the 15 reporting States totaled 138,120,000--slightly more than the previous week and 1 percent more than the comparable week last year. Broiler type hatching eggs set wer.e 171,935,000--1 percent more than the previous week and 1 percent more than the corresponding week a year earlier. Average hatchability for chicks hatched during the week was 82 percent. Average hatchability is calculated by dividing chicks hatched during the week by eggs set three weeks earlier.
Week Ended
GEORGIA BROILER TYPE EGGS SET AND CHICKS PLACEMENTS
Net Cross State
Eggs Set 11
Movement
Chicks Placed for
of Chicks
Broilers in Geore:ia
cYo of
%of
1996
1997
year 1996
1997
1996
1997
year
ago
ago
Thousands
Thousands
Thousands.
Sept. 27 26,762 28,068
105
+350 +207
Oct. 4 28,645 30,269
106.
+214
-29
Oct. 11 28,102 28,914
103
+444
-142
Oct. . 18 25,702 26,729
104
+22
-73
Oct. 25 25,918 27,470
106
+3
-312
Nov. 1 27,289. 27,773
102
-287
+40
Nov. 8 28,536 27,852
98
+318
+277
Nov. 15 .29,415 28, 770
98
+118
-195
Nov. 22 29,294 29,45 I
101
+511
,+736
Nov. 29 29,735 29,936
101
+363
+485
Dec. 6 29,098 29,527
101
+427 +357
Dec. 13 29,213 30,247* 104*
-152 +447
Dec. 20 29,097 29,797* 102
+450
+89
Dec. 27 29,689 30,314* 102
+334
-301 *
Jan. 3
29 541 30 363
103
+43
-200
I/ Includes eggs set by hatcheries producing chicks for hatchery supply tlocks. * Revised
23,165 21,333 21,557 21,427 22,840 23,033 21, 112 20,948 22,460 23.394 24,067 23,578 24,430 23,874 23 419
24,496 22,561 22,520 22,017 23,839 23,219 21,541 21,567 22,986 22;577 23,232 23,880* 24,046* 23,057* 23 886
106 106 104 103 104 101. 102 103 102
97 97 101 98 97* 102
Published: Weekly USDA/NASS COOPERATING WITH THE GEORGL\ DEPARTME'.'IT OF AGRICULTURE
IJRQl~E:R !YPE EGGS SET & CHICKS PLACED IN MAJO~ COMMER<JAL STATE:; BY WEE~ - _1_9_?J-19_9JL_
15 STATES
Ala. Ark. Calif.,Tenn.,W.Va. Del. Fla.
GA.
Dec J:"l
25,301 *
2').256 l(J,071 4,141 2,404
30,247 *
E(;G~~T
Week Ended
Dec.
Dec.
20
27
Thousands
25,260
25,552
29,561
29,605
9,876
9,912
4,623
4,339
2,558
2,743
29,797 *
30,314 *
Jan. 3
25,018 29,061 10,848
4,461 2.761'
30.363
%of year ~_I_! __
98 99 112 IOI 102
103
Md. Miss. N.C. Penn. S.C. Tex. Va.
TOTAL 15 STATES 1997-1998 1996-1997* % of Last Year
15 STATES
Ala. Ark. Calif.,Tenn.,W.Va. Del. Fla.
GA.
8,(i61 17,145 16,796 3,621 4,356
12,323 *
6,383
17(),705 *
169,406 IOI
flee. 13
18,424 23,251 9,(>07 4,510
2,249
23,880 *
8,688 17,385 17,078 3,481 4,353 12,247 _6,405 -
8,014 17.358 16,182
3,697 *
4,244 12,412
_M03
171,312 *
170,115
IOI
170,775 *
171,220 100
Cf:IJCKS PLJ\.{:E()
Week Ended
Dec.
Dec.
20
27
Thousands
18,386 25,501
18,047 * 24,700 *
10,207
9,648 *
5,572
5,938 *
2,746
2,863
24,046
23,057 *
:S.532 !7.315 16,940 3,604 4,215 12,411 6.401
17!,935 170,719
IOI
Jan.
-'
18,109 23,866
'l.711 4.960 2,297
23,886
98 IOI 98 102 96 103 98
101
%of year
--- --- ag_g_j/_ -
99 103 105 104 92
102
Md. Miss. N.C. Penn. S.C. Tex. Ya.
(i,534
5,557
5,310
6,184
96
13,936
14,793
14,195 *
l-Ul\
96
13, I (>7
13,800
12,200
l2.856
97
2.770
2,708
2,677 *
2.638
100
3,210
3,489
4,156
4.7 b0
125
9.62')
9,610
9,670
9.oOO
109
5,436
5,508
4,997 *
5.142
107
TOTAL 15 STATES
1997-1998
I.lli,603 *
141,923 *
137,458 *
l~S.120
IOI
1996-1997*
114,570
136,536
135,177
Ll6.i05
% of Last Year
102
104
102
lll I
*Revised. I/Current week as pen;~nl of same week last year.
ROBERT T. BASS State Statistician
CHRlS Ml SSER & FRIEDA DEKAZOS Agricultural Statistici1ms
Georgia Weekly Hatchery (ISSN 383-930) Is published weekly by th41 Georgia Agricultural Statistics Service, Athens, c;iA 306015099. Periodicals postage paid at Athens, GA. Subscription fee S 15 per year except free to data contributors. POSTMASTER: Send address changes to Georgia Agrl1=ultural Statistics Service. Stephens Federal Building, Sult41 320. Athens, GA 30601-5099.
~~ GEORGIA AGRICULTURAL STATISTICS - SERVICE STEPHENS FEDERAL BLDG. SUITE 320 ATHENS, GA 3060 l
PERIQDIQ\LS POSTAGE PAID AT ATHENS,GA 3060 l