- Collection:
- Georgia Government Publications
- Serial:
- Georgia farm report.
- Title:
- Crop news release, 2011 January 12
- Creator:
- Georgia. Department of Agriculture
- Contributor to Resource:
- United States. Department of Agriculture
United States. National Agricultural Statistics Service
United States. National Agricultural Statistics Service. Georgia Office - Publisher:
- Athens, Ga. : United States Department of Agriculture, National Agricultural Statistics Service, in cooperation with the Georgia Department of Agriculture, Georgia Field Office
- Date of Original:
- 2011-01-12
- Subject:
- Agricultural productivity--Georgia--Statistics
Crop yields--Georgia--Statistics - Location:
- United States, Georgia, 32.75042, -83.50018
- Medium:
- state government records
- Type:
- Text
- Format:
- application/pdf
- Description:
- Began in 1975?; ceased with vol. 10, no. 02 (Feb. 26, 2010).
"Agricultural statistician and Georgia Department of Agriculture."
Numbering began again with Vol. 11, no. 1 (Jan. 14, 2000).
Vols. for Aug. 31, 2005- issued by: USDA-NASS Georgia Field Office.
Description based on: Vol. 94, no, 1 (Jan. 4, 1994); title from caption.
Latest issue consulted: Vol. 10, no. 02 (Feb. 26, 2010). - External Identifiers:
- Call Number GA A400.C7 P1 F2 2011/1-12
- Metadata URL:
- https://dlg.galileo.usg.edu/id:dlg_ggpd_i-ga-ba400-pc7-bp1-bf2-b2011-s1-h12-belec-p-btext
- Digital Object URL:
- https://dlg.galileo.usg.edu/do:dlg_ggpd_i-ga-ba400-pc7-bp1-bf2-b2011-s1-h12-belec-p-btext
- Language:
- eng
- Holding Institution:
- University of Georgia. Map and Government Information Library
- Rights:
-

United States Department of Agriculture National Agricultural Statistics Service
Crop News Release
In Cooperation with the Georgia Department of Agriculture
Georgia Field Office 355 East Hancock Avenue, Suite 320 Athens, GA 30601 (706) 546-2236
www.nass.usda.gov
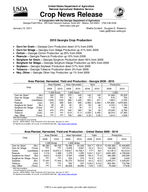
January 12, 2011
Media Contact: Douglas G. Kleweno
nass-ga@nass.usda.gov
2010 Georgia Crop Production
Corn for Grain Georgia Corn Production down 31% from 2009 Corn for Silage Georgia Corn Silage Production up 41% from 2009 Cotton Georgia Cotton Production up 20% from 2009 Peanuts Georgia Peanuts Production up 10% from 2009 Sorghum for Grain Georgia Sorghum Production down 46% from 2009 Sorghum for Silage Georgia Sorghum Silage Production up 36% from 2009 Soybean Georgia Soybean Production down 57% from 2009 Tobacco Georgia Tobacco Production down 2% from 2009 Hay, Other Georgia Other Hay Production up 1% from 2009
Area Planted, Harvested, Yield and Production - Georgia 2009 - 2010
Crop
Area Planted 2009 2010
Area Harvested 2009 2010
Yield 2009 2010
Production
2009
2010
Corn for Grain1
1,000 Acres
1,000 Acres
(Bu)
420
295 370
245
Corn for Silage
(Tons)
(NA)
(NA)
30
45
Cotton
(Lbs/Bales)
1,000 1330 990 1,320
Peanuts Sorghum for Grain1
(Lbs) (Bu)
510
565 505
555
55
45
40
25
Sorghum for Silage (Tons)
(NA)
(NA)
12
18
Soybean
(Bu)
470
270 440
260
Tobacco
(Lbs)
(NA)
(NA) 13.8
11.4
Hay, Other
(Tons)
(NA)
(NA) 700
650
(NA) Not Available 1 Area Planted for all purposes.
Source: USDA-NASS, Crop Production 2010 Summary, January 12, 2011.
All reports are available, at no cost, on the NASS web site: http://www.nass.usda.gov
140 17
902 3,560
53 11 36 2,030 2.30
145 16
811 3,560
46 10 26 2,400 2.50
1,000
51,800
35,525
510
720
1,860
2,230
1,797,800 1,975,800
2,120
1,150
132
180
15,840
6,760
28,014
27,360
1,610
1,625
Area Planted, Harvested, Yield and Production United States 2009 - 2010
Crop
Area Planted
2009
2010
Area Harvested
2009
2010
Yield 2009 2010
Production
2009
2010
Corn for Grain1
1,000 Acres
1,000 Acres
(Bu) 86,382 88,192 79,490 81,446
Corn for Silage (Tons)
(NA)
(NA)
5,605
5,567
Cotton
(Lbs/Bales) 9,149.5 10,973.2 7,528.7 10.706.7
Peanuts
(Lbs)
Sorghum for Grain1 (Bu)
1,116 6,633
1,288 5,404
1,079 5,520
1,255 4,808
Sorghum for Silage (Tons)
(NA)
(NA)
254
273
Soybean
(Bu) 77,451 77,404 76,372 76,616
Tobacco
(Lbs)
(NA)
(NA)
354
337
Hay, Other
(Tons)
(NA)
(NA) 38,528
39,906
(NA) Not Available
1 Area Planted for all purposes.
Source: USDA-NASS, Crop Production 2010 Summary, January 12, 2011.
All reports are available, at no cost, on the NASS web site: http://www.nass.usda.gov
164.7 19.3 777
3,421 69.4 14.5 44.0
2,323 1.99
152.8 19.3 821
3,311 71.8 12.5 43.5
2,133 1.95
1,000
13,091,862 12,446,865
108,209
107,314
12,187.5
18,314.5
3,691,650 4,155,600
382,983
345,395
3,680
3,420
3,359,011 3,329,341
822,581
719,786
76,628
77,653
USDA is an equal opportunity provider and employer.